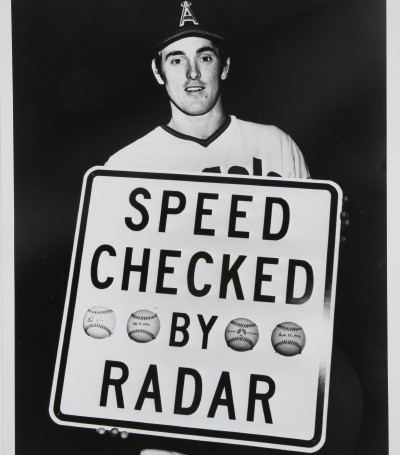
Fastest Pitchers Ever Recorded in MLB History
The Most Comprehensive List Since 2008 - Updated through World Series Game 4 10/27/2014

The question of which pitcher throws the hardest has been one of the most hotly debated questions in all of sports.
For the first time, our groundbreaking 50 Foot Equivalent (FFE) standard, allows Sports Illustrated, Wikipedia and others to rely on us to compare pitch speeds from all eras, and finally reveal the fastest MLB pitchers ever recorded.
Related:
- Aroldis Chapman's Record Setting 100mph Season in 2014
- The History of Radar Guns
- Fastest Pitchers in Japanese Baseball
- Fastest Pitchers in 2013
- 10/24/2014 game 3 - one 100+ pitch, Herrera 6th 100.6 mph
- 10/22/2014 game 2 - fastest pitch 101.4 mph (93.7 plate) 6th Herrera vs. Belt (plus 6th 100.5, 100.1,101.2,100.7,100.3,100.8,100.0 - 7th 100.1, 100.2, 100.1) - (99.8 max for Ventura 1st vs. Posey)
- 10/22/2014 - MLB Network said 'no pitcher has thrown a 100 mph pitch in the World Series since 2007'. Neftali Feliz threw 100.2 on 10/20/2011.
- 10/15/2014 heads up - Herrera threw a 100.3 mph pitch in the 7th, and Carlos Martinez threw 100.1 in the 5th
- 10/7/2014 - discovered Bullet Bob Turley's 103.2 mph pitch in 1954, placing him tied at 7th on the all time list.
- 10/7/2014 - complete revamp of the 1912-1974 Era - very complete history of various speed tests - don't miss this
- 10/5/2014 - discovered Joe Black's forgotten 102.2 mph pitch in 1953, placing him tied at 13th on the all time list. Joe was Jackie Robinson's roommate.
- 10/3/2014 - added known Pitch F/X data for preseason/exhibition games from 2008-2014. Discovered Andrew Cashman 103.3 mph pitch from 2012 which moved him up to 6th all time.
- In 2014, Aroldis Chapman becomes 1st pitcher to average 100+ mph for a season - 100.2 mph average fastball speed.
- In 2014, Aroldis Chapman threw an amazing 395 pitches - 62% of his fastballs and 42% of his total pitches - over 100 mph
- 9/28/2014 - added qty pitches thrown over 101/102/103/104/105 mph per season for years 2008-2014
- Hey CBS - Yordano Ventura did not throw 102.9 in 2014, or 102.8 in 2013
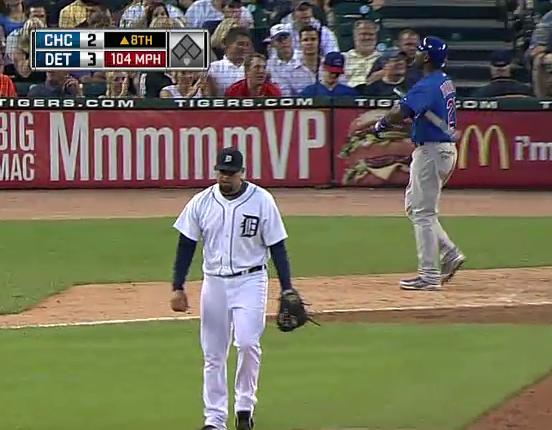
- Bruce Rondon, Tigers RH rookie, makes the 102+ list for the first time in 2013 with 102.8 mph.
- 9/12/2014 - added Mark Lowe to the 102+ list after discovering contemporary radar evidence/reports r11 from 2006.
- 9/17/2014 - added Jeremy Accardo to the 102+ list from 2006 radar readings after discovering his name in a BIS list r9.
- 9/19/2014 - added Josh Beckett to the 102+ list from 2004 radar readings reported by Associated Press r21 the day after the game.
- 9/19/2004 - added the Pitch F/X 100+ mph data for the 2006 post-season
- 10/2/2014 - realized that fangraphs does not include postseason PitchF/X data in its reports for some reason (corrected 2010-2013 years) - Verlander moves up the 102+ list with 102.4 mph pitch in 2011 postseason vs 2007 102 radar reading
- Jul/Sep 2014 Pitch F/X Era corrections: added Yordano Ventura (101.9) to 2013, plus Rubby De La Rosa (100.3) and Brandon League (100.1) to 2011.
- Sep 2014 Radar Era corrections: added lots of newly discovered under-102 mph pitchers/pitches during the 2002-2006 seasons
- Aroldis Chapman did not throw 106 mph on 4/18/2011
| Fastest Pitchers Ever - 102+ (UPDATED through 2014 reg season) | ||||||||
| Rank | Speed(mph) | Method u12 | Pitcher | Year | Throws | Lineup | Ht/Wt | ERA/ SO per 162 games |
| 1 | 108.1 FFE | laser radar | Nolan Ryan bio | 1974 | RHP | Starter | 6-2/195 | 3.19/ 246 |
| 2 | 107.6 FFE | chronograph | Bob Feller bio | 1946 | RHP | Starter | 6-0/185 | 3.25/ 167 |
| 3 | 105.1 | Pitch F/X | Aroldis Chapman bio | 2010 | LHP | Reliever | 6-4/185 | 2.32/ 113 ('14) |
| 4 | 104.8 | Pitch F/X | Joel Zumaya bio | 2006 | RHP | Reliever | 6-3/210 | 3.05/ 84 |
| 5 | 103.4 u3 | Pitch F/X | Neftali Feliz | 2010 | RHP | Closer | 6-3/215 | 2.53/ 75 ('14) |
| 6 | 103.3 preseasonu10 | Pitch F/X | Andrew Cashner | 2012 | RHP | Reliever | 6-6/200 | 3.25/ 116 ('14) |
| T7 | 103.2 u3 | Pitch F/X | Henry Alberto Rodriguez | 2010 | RHP | Reliever | 6-1/215 | 4.31/ 68 ('14) |
| T7 | 103.2 FFE | chronograph | Bob Turley | 1954 | RHP | Starter | 6-2/215 | 3.64/ 157 |
| 8 | 103 * Spring Training | radar | Mark Wohlers bio | 1995 | RHP | Closer | 6-4/207 | 3.97/ 71 |
| T9 | 102.8 u3 | Pitch F/X | Kelvin Herrera | 2012 | RHP | Reliever | 5-10/190 | 2.56/ 69 ('14) |
| T9 | 102.8 u5 | Pitch F/X | Bruce Rondon | 2013 | RHP | Reliever | 6-3/275 | 3.45/ 68 ('14) |
| 10 | 102.6 | Pitch F/X | Jonathan Broxton | 2009 | RHP | Closer | 6-4/295 | 3.07/ 78 ('14) |
| T11 | 102.5 FFE 93.5 plate speed | chronograph | Steve Dalkowski bio | 1958 | LHP | Starter | 5-11/175 | 5.38 (minors) |
| T11 | 102.5 u3 93.4 plate speed | Pitch F/X | Bobby Parnell | 2010 (and 2011) | RHP | Reliever | 6-4/200 | 3.57/ 62 ('14) |
| 12 | 102.4 u9 | Pitch F/X | Justin Verlander | 2011 | RHP | Starter | 6-5/225 | 3.53/ 209 ('14) |
| T13 | 102.2 | Pitch F/X | Brian Wilson | 2009 | RHP | Closer | 6-1/195 | 3.30/ 70 ('14) |
| T13 | 102.2 FFE | chronograph | Joe Black bio | 1953 | RHP | Reliever | 6-2/220 | 3.91/ 80 |
| T14 (1st one) | 102 | radar | Robb Nen | 1997 | RHP | Closer | 6-5/220 | 2.98/ 83 |
| T14 | 102 | radar | Bobby Jenks | 2005 | RHP | Closer | 6-3/275 | 3.21/ n/a |
| T14 | 102 | radar | Randy Johnson | 2004 | LHP | Starter | 6-10/225 | 3.29/ 271 |
| T14 | 102 | radar | Josh Beckett | 2004 | RHP | Starter | 6-5/230 | 3.88/ 194 ('14) |
| T14 | 102 | radar | Jeremy Accardo | 2006 | RHP | Closer | 6-0/195 | 4.30/ 53 |
| T14 | 102 | radar | Brad Lidge | 2006 | RHP | Closer | 6-5/215 | 3.54/ 90 |
| T14 | 102 | radar | Matt Lindstrom | 2007 | RHP | Reliever | 6-3/220 | 3.68/ 47('14) |
| T14 | 102 | radar | Mark Lowe | 2006 | RHP | Reliever | 6-3/210 | 4.16/ 61 |
| T14 | 102 | radar | Armando Benitez | 2002 | RHP | Closer | 6-4/260 | 3.13/ 84 |
Today's MLB standard uses pitch speed measured at 50 feet from home plate. See detailed calculations in that pitcher's section below.
Still Think Aroldis Chapman's 105.1 mph Pitch F/X Ball is Fastest?
Do you still think Aroldis Chapman's 105.1 mph pitch was faster than Ryan or Feller? You're skeptical of the FFE measurement?Consider this. As the balls crossed the plate, Chapman's was traveling 96.5 mph, Bob Feller's was at 98.6 mph, and Nolan Ryan's was still moving at an astonishing 99.1 mph.
Page Navigation - Jump Directly To The Section
Fastest Pitchers Ever List - 102+ MPH100+ MPH Pitches in the PitchF/X Era: 2014 2013 2012 2011 2010 2009 2008 2007 2006
Bios: Joe Black , Aroldis Chapman , Steve Dalkowski , Bob Feller , Sidd Finch , Nolan Ryan , Mark Wohlers Joel Zumaya
FFE Calculation
Understanding Pitch Speed Measurements - Pitch F/X, Radar, Laser
100+ MPH Pitches in the Radar Gun Era: 2007 2006 2005 2004 2003 2002 1975-2001 Radar Rumors
Pitch Speeds in the Pre Radar Gun Era - 1912 to 1974
Related Articles
Sources and Updates: Radar Sources All Other Sources Updates
Pitch F/X Era - late 2006 to present
2014 Season Fastest Pitchers 100+ - through 10/5/2014 [qty 100+/101+/102+/103+]
Of the 17 pitchers from the 2013 list, only 7 of these pitchers have topped 100 mph so far. Aroldis Chapman leads the way at 103.8 mph.First the 101+ crowd from 2013:
- 103.8 [395/207/67/11] Aroldis Chapman (Reds), closer, 7/28/2014 9th inning vs Arizona's Paul Goldschmidt 5th pitch, in Cincinnati, 95.6 mph plate speed Chapman threw an amazing 395 pitches - 62% of his fastballs and 42% of his total pitches - 100 mph or more this season
- on DL, Bruce Rondon (Tigers), reliever
- 99.2 Henry Alberto Rodriguez (Nationals), reliever
- 102.0 [53/5/1] Yordano Ventura (Royals), 10/3/2014, starter (2013 rookie)
- 101.4 [79/5] Kelvin Herrera (Royals), reliever (twice, 7/30 vs. Josh Willingham, and 10/22 vs. Giant's Brandon Belt in World Series Game 2)
- 100.5 [9] Trevor Rosenthal (Cardinals), reliever (on 8/3/14)
- 100.9 [21] Carlos Martinez (Cardinals), starter
- 99.9 Craig Kimbrel (Braves), closer
- 100.0 [1] Gerrit Cole (Pirates), starter (2013 rookie)
100.4 [1] Nathan Eovaldi , (Marlins) starter (8/26/14 3rd vs. Trout), Nate Jones, reliever (97.4), Fernando Rodney, reliever (98.7), Jose Dominguez, 2013 rookie reliever (98.9), Andrew Cashner, starter (98.4), Greg Holland, reliever (99.1), Jeremy Jeffress, reliever (99.7), Matt Harvey, starter (on DL), and Danny Salazar, 2013 rookie starter (98.5).
Here are the 2014 newcomers to the 100+ list that I have confirmed:
- 101.0 [8/1] Ken Giles, Phillies closer, 9th vs. Ian Desmond, 8/27/14
- 101.0 [20/1] Erik Cordier, Giants rookie (7th inning vs. Matt McBride 9/3/2014) (his first MLB pitch was 100.4 mph on 9/3/2014)
- 100.9 [6] Carter Capps, Marlins reliever, 7th vs. Matt Kemp, 5/3/14
- 100.5 [1] Brandon Morrow, Blue Jays closer (9th inning vs Jorge Soler 9/10/2014)
- 100.4 [4] Dellin Betances, Yankees 8/2/14
- 100.2 [1] Jake McGee, Rays reliever (vs Edwin Encarnacion 5/28/2014)
- 100.2 [1] Mike Foltynewicz, Astros rookie closer (9th inning vs Rangers' Rougned Odor 8/9/2014)
- 100.1 [1] Jumbo Diaz, Reds rookie reliever (6th inning vs Casey McGehee 8/9/14)
- 100.0 [1] Jake Diekman, Phillies reliever (vs Giancarlo Stanton 6/26/2014)
- 100.0 [1] Hunter Strickland, Giants rookie reliever, 10/3/2014 6th inning vs. Nationals' Ian Desmond
2014 PostSeason included above
During the 2014 postseason through 10/22 there have been 41 100+ mph pitches, 102.0 [12/3/1] Yordano Ventura 10/3/14 vs David Freese , 101.4 [22/3] Kelvin Herrera , 100.3 [3] Trevor Rosenthal , 100.3 [3] Carlos Martinez , and 100.0 [1] Hunter Strickland.2014 World Series included above
During the 2014 World Series through 10/22, there have been 12 100+ mph pitches, 101.4 [12/2] Kelvin Herrera on 10/22.2014 Preseason not included above
One pitcher threw 7 100+ mph pitches during 2014 preseason/exhibition games. Yordano Ventura (Royals) threw 100.8 [7] on 3/17/2014 vs. Elvis Andrus. u10Source - manual review of FanGraphs.com PITCH F/X data, and MLB PITCH F/X details , quantity of 100+ pitches indicated by '[xx]' per BaseballSavant.com's PITCH F/X data
Note- for some reason, Fangraphs does not include Pitch F/X data for postseason games
2013 Season Fastest Pitchers 100+ [qty 100+/101+/102+/103+/104+] u5 (7/31/2014) u9 (10/2/2014)
18 pitchers threw 476 pitches 100+ mph in during the 2013 regular/post season. Of the 476 pitches, 159 were 101+, 41 were 102+, 10 were 103+, and one was 104+ mph. u9Seven starters (Ventura, Cole, Martinez, Eovaldi, Harvey, Cashner, Salazar) and 11 relievers. u9
First, 9 pitchers threw 101+ mph during the 2013 regular/post season:
- 104.0, [215/93/27/10/1] Aroldis Chapman (Reds), 7/12/2013, 9th inning closer vs. Freddie Freeman (Braves) 3rd pitch at Turner Field Atlanta, ball, 95.3 mph plate speed
- 102.8, [113/47/11] Bruce Rondon (Tigers rookie), 8/7/2013, 8th inning relief vs. Ryan Raburn (Indians) 4th pitch in Cleveland, swinging strike, 93.9 mph plate speed (makes 102+ list)
- 102.3, [30/9/3] Henry Alberto Rodriguez (last game with Nationals), 6/1/2013, 10th inning relief vs. Evan Gattis (Braves) at Turner Field Atlanta, ball, 94.6 mph plate speed
- 101.9, [4/1] Yordano Ventura (Royals), 9/17/2013, starter (2013 rookie), 3rd inning vs. Yan Gomes (Indians) at Kauffman Stadium, line drive, 92.8 mph plate speed Correction - added on 7/31/2014
- 101.5, [47/5] Kelvin Herrera (Royals), 6/18/2013 8th inning relief vs. Michael Bourn (Indians) at Cleveland, ball, 92.9 mph plate speed
- 101.4, [18/1] Trevor Rosenthal (Cardinals), reliever (100.9 max 2012) vs. Cesar Izturis 4/8/2013
- 101.3, [6/1] Carlos Martinez (Cardinals), starter (rookie) vs. Junior Lake 9/27/2013
- 101.2, [3/1] Craig Kimbrel (Braves), closer vs. Juan Uribe 10/4/2013 Correction - added on 10/3/2014 u9
- 101.0, [11/1] Gerrit Cole (Pirates), starter (rookie) vs. Alberto Callaspo 6/21/2013
- 100.8 [10] Nate Jones, reliever on 6/5/2013
- 100.7 [7] Fernando Rodney, reliever on 5/21/2013
- 100.6 [4] Jose Dominguez, rookie reliever three times (twice on 6/3/2013, and on 7/12/2013)
- 100.2 [2] Danny Salazar, rookie starter on 10/2/2013 vs. David DeJesus u9
- 100.2 Andrew Cashner, starter on 8/31/2013
- 100.2 Greg Holland, reliever on 6/17/2013
- 100.1 Jeremy Jeffress, reliever on 9/4/2013
- 100.1 Nathan Eovaldi, starter on 8/4/2013
- 100.1 [2] Matt Harvey, starter twice 6/18/2013 and 6/23/2013
2013 PostSeason included above
During the 2013 postseason, there were 11 100+ mph pitches. Craig Kimbrel fastest at 101.2 mph [3/1] on 10/4/2013, Carlos Martinez 100.8 [1], Trevor Rosenthal 100.6 [2], Gerrit Cole 100.2 [3], Danny Salazar 100.2 [1], and Fernando Rodney 100.1 [1].2013 World Series included above
During the 2013 World Series, the fastest pitch was 99.8 mph by Carlos Martinez on 10/28/2013. u92014 Preseason not included above
During the 2013 preseason/exhibition games, there were no 100+ mph pitches thrown. u10Source - manual review of FanGraphs.com PITCH F/X data, and MLB PITCH F/X details , quantity of 100+ pitches indicated by '[xx]' per BaseballSavant.com's PITCH F/X data
Note- for some reason, Fangraphs does not include Pitch F/X data for postseason games

2012 Season Fastest Pitchers 100+ [qty 100+/101+/102+] u3 u9
15 pitchers threw 414 pitches 100+ mph during the 2012 regular/post season. Of the 414 pitches, 93 were 101+, and 12 were 102+ mph. u9(See Andrew Cashner's 103.3 mph preseason pitch in Preseason section.)
- 102.8, [81/14/2] Kelvin Herrera (Royals), 4/17/2012 9th inning closer vs. Don Kelly (Tigers) at Kauffman Stadium, fouled off, 92.5 plate speed
- 102.7, [163/57/9] Aroldis Chapman (Reds), 8/11/2012, 9th inning closer vs. Starlin Castro (Cubs) at Wrigley Field, ball, 93.1 plate speed u9
- 102.0, [61/13/1] Andrew Cashner (Padres), 5/12/2012 8th inning relief vs. John Mayberry (Phillies) at Citizens Bank Park, ball, 93.1 mph plate speed (see preseason section below for 103.3 mph pitch)
- 101.5, [12/1] Bobby Parnell (Mets), 5/20/2012 8th inning relief vs Yan Gomes (Blue Jays) in Toronto, swinging strike, 91.3 mph plate speed
- 101.5, [21/3] Justin Verlander (Tigers), 5/24/2012 8th inning start vs. Asdrubal Cabrera (Indians) at Progressive Field Cleveland, ball, 94.2 mph plate speed
- 101.4, [26/3] Henry Alberto Rodriguez (Nationals), twice (vs Adam Kennedy and A.J. Ellis) on 4/28/2012
- 101.2, [14/1] Trevor Rosenthal vs. Ryan Zimmerman 10/8/2012 Correction - moved to 101+ list on 10/3/2014 u9
- 101.1, [10/1] Nate Jones (White Sox), vs Gerald Laird 9/2/2012
- 100.9 [16] Carter Capps four times 9/4 8/31 8/24 and 8/24/2012
- 100.4 [3] Fernando Rodney twice on 9/1/2012
- 100.2 [2] Jason Motte on 10/12/2012 u9
- 100.1 [1] Jonathan Broxton on 5/3/2012
- 100.1 [1] Tommy Hunter on 9/22/2012
- 100.0 [2] John Axford twice on 5/28/2012
- 100.0 [1] Alexi Ogando on 8/8/2012
2012 PostSeason included above
During the 2012 postseason, there were 18 100+, and one 101+ mph pitches thrown, with Trevor Rosenthal fastest at 101.2 mph.2012 World Series included above
There were no 100+ mph pitches thrown in the World Series, Justin Verlander threw the fastest at 98.0 mph on 10/24/2012. u92012 Preseason not included above
During the 2012 preseason/exhibition games, one pitcher threw 13 100+ pitches. u10- 103.3 [13/9/7/1] Andrew Cashner (Padres) reliever 3/4/2012, 6th inning vs. Mariners' Johermyn Chavez 3rd pitch, 93.6 mph plate speed This moves him up to 6th on the 102+ list - added 10/3/2014
Source - manual review of FanGraphs.com PITCH F/X data, and MLB PITCH F/X details , quantity of 100+ pitches indicated by '[xx]' per BaseballSavant.com's PITCH F/X data
Note- for some reason, Fangraphs does not include Pitch F/X data for postseason games
2011 Season Fastest Pitchers 100+ [qty 100+/101+/102+/103+] u3 u9
13 pitchers threw 312 pitches 100+ mph during the 2011 regular/post season. Of the 312 pitches, 70 were 101+, 12 were 102+, and 2 were 103+ mph. u9- 103.4, [110/40/10/2] Aroldis Chapman (Reds), 4/9/2011 8th inning vs. Miguel Montero (Diamondbacks) at Chase Field, ball in dirt, plate speed 95.9 mph
- 102.5, [45/11/1] Bobby Parnell (Mets), 6/29/2011 7th inning vs. Miguel Cabrera (Tigers) at Comerica Park, ball, plate speed 92.3 mph
- 102.4, [29/10/1] Justin Verlander (Tigers) 10/13/2011 5th inning vs. Adrian Beltre (Rangers) 1st pitch in Detroit, plate speed 93.8 mph He moves up the 102+ list from his previous 102 radar reading in 2007 u9
- 101.4, [73/6] Henry Alberto Rodriguez (Nationals) 8/6/2011 vs Chris Nelson
- 101.4, [19/2] Neftali Feliz on 10/8/2011 vs. Austin Jackson u9
- 101.2, [4/1] Maikel Cleto (Cardinals) on 6/21/2011 vs Chase Utley
- 100.6 [18] Jordan Walden three times - twice on 7/10/2011 and on 5/25/2011
- 100.5 [4] Daniel Bard twice - on 8/6/2011 and 7/5/2011
- 100.4 [2] Jeremy Jeffress on 4/16/2011
- 100.3 [1] Rubby De La Rosa on 7/25/2011 (**)
- 100.2 [4] Chris Carpenter twice on 6/22/2011
- 100.1 [1] Brandon League on 6/8/2011 (**)
- 100.0 [2] Craig Kimbrel twice - on 9/28/2011 and 9/12/2011
2011 Postseason included above
During the 2011 postseason, there were 15 100+ mph pitches - Justin Verlander fastest at 102.4 mph [8/3/1] and Neftali Feliz 101.4 [7/2].2011 World Series included above
During the 2011 World Series, there was one 100+ mph pitch by Neftali Feliz of 100.2 mph on 10/20/2011. u92011 Preseason not included above
No pitcher threw 100+ mph during the 2011 preseason/exhibition games. u10Source - manual review of FanGraphs.com PITCH F/X data, and MLB PITCH F/X details , quantity of 100+ pitches indicated by '[xx]' per BaseballSavant.com's PITCH F/X data
Note- for some reason, Fangraphs does not include Pitch F/X data for postseason games
(**) corrected to add to list on 9/11/2014

2010 Season Fastest Pitchers 100+ u3 u9 [qty 100+/101+/102+/103+/104+/105+]
19 pitchers threw 455 pitches 100+ mph during the 2010 regular/post season. Of the 455 pitches, 143 were 101+, 45 were 102+, 16 were 103+, 2 were 104+, and one was 105+ mph. u9- 105.1, [87/51/32/14/2/1] Aroldis Chapman (Reds), 9/24/2010 8th inning, vs. Tony Gwynn Jr. (Padres) a PETCO Park, ball, plate speed 96.5 mph u9
- 103.4, [35/14/4/1] Neftali Feliz (Rangers), 9/1/2010 entered 9th inning in relief, vs. Mike Aviles (Royals) at Kauffman Stadium, ball, plate speed 91.7 mph u9
- 103.2, [89/24/3/1] Henry Alberto Rodriguez (Athletics), 9/15/2010 reliever 7th inning, vs. Mike Aviles (Royals) at Kauffman Stadium - 93.0 plate speed, ball for walk
- 102.5, [18/4/2] Bobby Parnell (Mets), 8/18/2010 entered 11th inning, vs. Chris Johnson (Astros) at Minute Maid Park, swinging strikeout, 93.4 plate speed
- 102.2, [144/43/4] Joel Zumaya (Tigers), 5/28/2010, entered 9th inning vs. Landon Powell (Athletics) at Comerica Park, ball, 93.5 plate speed
- 101.6, [15/4] Justin Verlander (Tigers) 9/29/2010
- 101.5, [28/3] Jordan Walden (Angels) 9/22/2010
- 100.8 [18] Daniel Bard 6/1/2010
- 100.6 [5] Ubaldo Jimenez 5/3/2010 (corrected on 9/11/2014 from 100.1 mph)
- 100.4 [3] Stephen Strasburg 6/13/2010
- 100.4 [2] Mitchell Boggs 7/22/2010
- 100.3 [2] Chris Sale 8/21/2010
- 100.2 [2] Alexi Ogando twice on 8/31/2010
- 100.2 Jonathan Broxton 7/18/2010
- 100.1 [2] Andrew Cashner 6/26/2010
- 100.1 Jason Motte 7/6/2010
- 100.1 Fernando Rodney 8/5/2010
- 100.1 Kyle Farnsworth 4/23/2010
- 100.1 Edwin Jackson 9/17/2010
2010 PostSeason included above
During the 2010 postseason, there were 14 100+ mph pitches - Aroldis Chapman fastest at 103.5 mph [12/2/1/1] and Neftali Feliz 100.3 [2]. u92010 World Series included above
During the 2010 World Series, Neftali Feliz threw the fastest pitch of 98.8 mph twice on 10/30/2010.2010 Preseason not included above
One pitcher threw 4 100+ mph pitches during 2010 preseason/exhibition games. Neftali Feliz threw 100.5 [4] on 3/29/2010. u10Source - manual review of FanGraphs.com PITCH F/X data, and MLB PITCH F/X details , quantity of 100+ pitches indicated by '[xx]' per BaseballSavant.com's PITCH F/X data
Note- for some reason, Fangraphs does not include Pitch F/X data for postseason games
Note: Pitch F/X shows Phil Coke with 2 pitches of 101.3 and 101.5 mph on 6/5/2010 vs. Jose Guillen. I have not included these pitches in the above list, since his fastest career pitch was over 4 mph slower at 97.2 mph on 9/4/2010. The odds are better that Pitch F/X was wrong vs. him throwing 4 mph faster than ever.
2009 Season Fastest Pitchers 100+ (qty 100+/101+/102+)
16 pitchers threw 272 pitches 100+ mph during the 2009 regular/post season. Of the 272 pitches, 64 were 101+, and 9 were 102+ mph.- 102.7 (138/47/6), Joel Zumaya (Tigers) reliever, 6/23/2009 8th inning vs. the Cubs' Milton Bradley 2nd pitch, in Detroit, 94.7 plate speed, (he threw 10 100+ mph pitches that game) and again on 6/30/2009, 7th inning vs. Oakland's Matt Holliday 7th pitch, Oakland Coliseum, 91.4 mph plate speed (he threw 8 100+ mph pitches that game)
- 102.6 (39/8/2), Jonathan Broxton (Dodgers) closer, 7/3/2009, 9th inning vs. Padres' Kevin Kouzmanoff 4th pitch, PETCO Park, 94.3 mph plate speed
- 102.2 (16/6/1), Brian Wilson (Giants) closer, 9/5/2009, 9th inning vs. Brewers' Jason Kendall 2nd pitch, Miller Park, 92.2 mph plate speed
- 101.3 (12/1), Daniel Bard (Red Sox), 7/30/2009, Fenway Park
- 101.1 (14/1), Neftali Feliz (Rangers), 8/7/2009, Angel Stadium Anaheim
- 101.0 (15/1), Justin Verlander (Tigers), 9/19/2009, Metrodome
- 100.9 (3) Bobby Parnell 7/3/2009
- 100.6 (11) Henry Alberto Rodriguez (Athletics) twice on 10/2/2009
- 100.6 (14) Ubaldo Jimenez 8/7/2009
- 100.3 (1) Juan Morillo 4/27/2009
- 100.2 (1) Matt Lindstrom 6/13/2009
- 100.2 (1) Merkin Valdez 9/6/2009
- 100.2 (4) Kyle Farnsworth 9/4/2009
- 100.1 (1) Fernando Rodney 8/24/2009
- 100.0 (1) Kevin Jepsen 8/8/2009
- 100.0 (1) Mark Lowe 6/5/2009
2009 PostSeason included above
In the 2009 postseason, 8 100+ mph pitches were thrown - Jonathan Broxton 101.3 (2/1), Daniel Bard 100.6 (3), and Ubaldo Jimenez 100.5 (3) u92009 World Series included above
In the 2009 World Series, no 100+ mph pitches were thrown - Joba Chamberlain was fastest at 97.1 on 11/1/2009.2009 Preseason not included above
There was some Pitch F/X data for 2009 preseason games on March 15,16,17, and 19th, and for exhibition games in home parks on April 2,3, and 4th, but no pitcher threw 100+ mph. u10Source - eFastball.com PITCH F/X data, and MLB PITCH F/X details , quantity of 100+ pitches per eFastball.com Pitch F/X , qty of 101+ and above per BaseballSavant.com's PITCH F/X data
2008 Season Fastest Pitchers 100+ (qty 100+/101+)
10 pitchers threw 67 pitches 100+ mph during the 2008 regular/post season. Of the 67 pitches, 6 were 101+ mph.- 101.3 (32/4), Joel Zumaya (Tigers) reliever, 6/20/2008, 8th inning vs. Padres' Paul McAnulty 8th pitch PETCO Park, 90.7 mph plate speed (he threw 7 100+ mph pitches in this at bat) (corrected 12/11/12 u2)
- 101.0 (12/1), Jonathan Broxton (Dodgers) closer, 8/21/2008, 9th inning vs. Rockies' Troy Tulowitzki 1st pitch, Dodger Stadium, 92.2 mph plate speed
- 101.0 (9/1), Matt Lindstrom (Marlins) reliever, 7/10/2008, 7th inning vs. Dodgers' Matt Kemp 1st pitch, Dodger Stadium, 92.0 mph plate speed
- 100.6 Ervin Santana (2) 6/25/2008
- 100.4 Ubaldo Jimenez (3) twice - 8/12/2008 and 4/15/2008
- 100.3 Brandon League (3) 9/13/2008 (added - see update u2)
- 100.2 Fernando Rodney (1) 8/5/2008
- 100.2 Brian Wilson (1) 7/28/2008
- 100.2 Joba Chamberlain (1) 6/8/2008 (see note below)
- 100.1 Juan Morillo (3) three times on 7/20/2008
2008 PostSeason included above
During the 2008 postseason, there was not a single pitch thrown 100+ mph. The fastest postseason pitch was 99.8 mph by Jonathan Broxton on 10/4/2008,2008 World Series included above
The fastest World Series pitch was 97.8 mph by Edwin Jackson on 10/26/2008. u92008 Preseason not included above
There was some Pitch F/X data for 2008 exhibition games in home parks on March 28, 29, and 30th, but no pitcher threw 100+ mph. u10Source - eFastball.com PITCH F/X data, and MLB PITCH F/X details , quantity of 100+ pitches per eFastball.com Pitch F/X , qty of 101+ and above per BaseballSavant.com's PITCH F/X data
Note - Joba Chamberlain threw a 99.6 mph pitch on 7/19/2008 in the 6th inning that showed 101mph on the stadium radar.
2007 Season Fastest Pitchers 100+ u7u3 u9 (These is only the partial year Pitch F/X data)
18 pitchers threw 100+ mph during the 2007 regular/post season. (It is unknown at this time how many 100+ mph pitches each pitcher threw)- 102.2, Joel Zumaya (Tigers), 4/12/2007 vs. Blue Jays' Frank Thomas 9th inning last pitch, 91.1 mph plate speed (threw 13 pitches 100+ that game)
- 101.7, Justin Verlander (Tigers), 7/15/2007 vs. Mariners' Ben Broussard 1st inning 3rd pitch, 89.4 mph plate speed (threw 8 100+ pitches that game)
- 101.6, Felix Hernandez (Mariners), 8/13/2007 vs. Twins' Alexi Casilla 1st inning 4th pitch, 90.3 mph plate speed (see note below)
- 101.6, J.J. Putz (Mariners), 7/28/2007 vs. Oakland's Nick Swisher 9th inning 5th pitch, 88.5 mph plate speed (he threw 8 100+ pitches that game)
- 101.4, Jonathan Broxton (Dodgers), 4/29/2007 vs. Padres' Khalil Greene 8th inning 2nd pitch, 87.4 mph plate speed (he threw 4 100+ pitches that game)
- 101.2, Ubaldo Jimenez (Rockies), 8/15/2007 vs. Padres' Josh Bard 3rd inning 3rd pitch, 90.5 mph plate speed (he threw 15 100+ pitches that game)
- 101.0, Joba Chamberlain (Yankees), twice - 9/7/2007 vs. Royals' Billy Butler 7th inning 2nd pitch, 91.4 mph plate speed (3 100+ pitches that game)
,
then again on 9/12/2007 vs. Toronto's Frank Thomas 8th inning 2nd pitch, 86.7 mph plate speed (threw 3 100+ pitches that game)
- 100.9 Kyle Farnsworth Yankees, 5/12/2007 8th vs. Mariners' Kenji Johjima (also threw 100.0, 100.1, and 100.2 in the same inning)
- 100.8 (2) Daniel Cabrera, 7/18/2007 2nd inning vs. Mariners' Richie Sexson (also threw 100.3 on 6/6)
- 100.7 (2) Jeremy Guthrie Orioles, 8/19/2007 7th inning vs. (Blue Jays) Troy Glaus 1st pitch (he also threw 100.2 that game) (see note)
- 100.6 Matt Lindstrom Marlins, 7/3/2007 8th inning vs. Padres' Josh Bard 2nd pitch (also threw 100.4 and 100.3 same inning)
- 100.5 Jim Hoey Orioles, 8/18/2007 7th inning vs. Toronto's Vernon Wells 3rd pitch (he also threw 100.2 and 100.4 in the same inning)
- 100.5 Dustin McGowan, Blue Jays, 6/29/2007 1st inning vs. Mariners' Kenji Johjima 2nd pitch (threw 3 100+ pitches that game)
- 100.2 (2) Manny DelCarmen RedSox, 8/5/2007 8th inning to Mariners' Adam Jones 1st pitch (he also threw 100.1 to Jones on 8/3)
- 100.2 Jake Peavy Padres, 5/16/2007 1st inning vs. Reds' Brandon Phillips 3rd pitch
- 100.1 A.J. Burnett Blue Jays, 9/13/2007 1st inning vs. Yankees' Johnny Damon 2nd pitch
- 100.0 Jonathan Papelbon Red Sox, 6/27/2007 9th inning vs. Mariners' Ben Broussard 3rd pitch
- 100.0 Edwin Jackson Rays, 8/27/2007 6th inning vs. White Sox' Paul Konerko 3rd pitch
2007 Postseason/World Series included above
During the 2007 postseason, there was not a single pitch thrown 100+ mph. I do not know the fastest pitch thrown during the 2007 postseason or the world series - it's a manual todo item.u92007 Preseason not included above
(There may be some Pitch F/X data for 2007 exhibition games in home parks, but they have not yet been reviewed and are not listed here) u10Source - manual review of FanGraphs.com PITCH F/X data, and MLB PITCH F/X details. Since Fangraphs doesn't include postseason Pitch F/X data, I scoured every postseason 2007 game manually.
Note: Roy Halladay
The Pitch F/X data on 6/30/2007, shows Roy Halladay (Blue Jays vs. Mariners) with a 101.8 mph pitch in the 3rd vs. Jose Guillen and a 100.7 mph pitch in the 2nd vs Kenji Johjima. I don't think this data is correct and have not listed these pitches above. The 101.8 pitch showed an 'end speed' of 80.1 mph. That's not possible at 101.8. The 100.7 mph pitch showed an 'end speed' of 78.9 mph. Again, not possible. Other than these two recordings, Halladay was throwing fastballs ranging from 90.4 mph start speed and 80.1 end speed, to a max of 96.3 mph start speed and 85.0 end speed - generally 10 mph reduction from the hand to home plate. So, it's more likely that these two 100+ recordings were 10 mph too fast. I'm not sure how this happened.
Note: Felix Hernandez
Manually checked the Jul/Aug 2007 100+ Pitches by game - 7/7 (0), 7/12 100.2 max (6), 7/17 and 7/22 (0), 7/27 100.8 max (10), 8/1 101.1 max (8), 8/13 101.6 max (8), 8/19 100.3 max (4), 8/24 (0), 8/29 101.0 max (4),
Note: Jeremy Guthrie
Reviewed all Pitch F/X games 6/3, 6/20, 7/6, 7/17, 7/22, 8/2, and 8/19/2007.
2006 Post Season - Pitch F/X was used for some games (qty 100+/101+/102+/103+/104+) u8
MLB began to use Pitch F/X late 2006, and I scoured every post-season game for 100+ mph pitches. There was speed data for only 23 of the 31 postseason games, and here are the results.2006 PostSeason
Four pitchers threw 27 pitches 100+ mph in these 23 games during the 2006 postseason. Some of these are likely duplicates of the 2006 radar readings section. Of the 27 pitches, 12 were 101+, 6 were 102+, 3 were 103+, and one was 104+ mph.- 104.8 (14/9/6/3/1) Joel Zumaya Tigers, 10/10/2006 8th inning vs Oakland's Frank Thomas 3rd pitch, 93.7 mph plate speed
- 101.9 (11/3) Justin Verlander Tigers, 10/5/2006 1st inning vs Yankees' Bobby Abreu 3rd pitch, 90.9 mph plate speed
- 100.8 (1) Esteban Loaiza, Athletics 10/11/06 5th inning vs Tigers' Ivan Rodriguez 5th pitch, 89.5 mph plate speed
- 100.7 (1) Scott Proctor, Yankees 10/5/06 8th inning vs Tigers' Ivan Rodriguez 1st pitch, 92.7 mph plate speed
| date | game | inning | pitcher | start | plate | batter | Pitch # to batter | |
|---|---|---|---|---|---|---|---|---|
| 10/05/06 | NYY vs DET | 8 | Scott Proctor | 429984 | 100.7 | 92.7 | Ivan Rodriguez | 1 |
| 10/05/06 | NYY vs DET | 1 | Justin Verlander | 434378 | 101.9 | 90.9 | Bobby Abreu | 3 |
| 10/05/06 | NYY vs DET | 1 | Justin Verlander | 434378 | 101.3 | 90.5 | Gary Sheffield | 4 |
| 10/05/06 | NYY vs DET | 1 | Justin Verlander | 434378 | 100.8 | 89.8 | Jason Giambi | 1 |
| 10/05/06 | NYY vs DET | 1 | Justin Verlander | 434378 | 100.9 | 90.4 | Jason Giambi | 2 |
| 10/05/06 | NYY vs DET | 2 | Justin Verlander | 434378 | 100.1 | 90.2 | Robinson Cano | 4 |
| 10/05/06 | NYY vs DET | 2 | Justin Verlander | 434378 | 100.5 | 90.3 | Robinson Cano | 6 |
| 10/05/06 | NYY vs DET | 7 | Joel Zumaya | 451491 | 101 | 92.2 | Derek Jeter | 1 |
| 10/05/06 | NYY vs DET | 8 | Joel Zumaya | 451491 | 100.7 | 91.5 | Jason Giambi | 2 |
| 10/05/06 | NYY vs DET | 8 | Joel Zumaya | 451491 | 102.9 | 91.3 | Jason Giambi | 5 |
| 10/05/06 | NYY vs DET | 8 | Joel Zumaya | 451491 | 102.5 | 93.4 | Hideki Matsui | 2 |
| 10/05/06 | NYY vs DET | 8 | Joel Zumaya | 451491 | 102.2 | 91.9 | Hideki Matsui | 3 |
| 10/05/06 | NYY vs DET | 8 | Joel Zumaya | 451491 | 100.2 | 90.7 | Hideki Matsui | 4 |
| 10/10/06 | DET vs OAK | 8 | Joel Zumaya | 451491 | 103.4 | 92.8 | Frank Thomas | 1 |
| 10/10/06 | DET vs OAK | 8 | Joel Zumaya | 451491 | 104.8 | 93.7 | Frank Thomas | 3 |
| 10/10/06 | DET vs OAK | 8 | Joel Zumaya | 451491 | 101.5 | 90.8 | Frank Thomas | 4 |
| 10/10/06 | DET vs OAK | 8 | Joel Zumaya | 451491 | 103.4 | 92.8 | Jay Payton | 1 |
| 10/11/06 | DET vs OAK | 5 | Esteban Loaiza | 117842 | 100.8 | 89.5 | Ivan Rodriguez | 5 |
| 10/11/06 | DET vs OAK | 1 | Justin Verlander | 434378 | 100.4 | 89.4 | Frank Thomas | 2 |
| 10/11/06 | DET vs OAK | 1 | Justin Verlander | 434378 | 101 | 89.8 | Eric Chavez | 4 |
| 10/11/06 | DET vs OAK | 1 | Justin Verlander | 434378 | 100.7 | 90.5 | Eric Chavez | 5 |
| 10/11/06 | DET vs OAK | 3 | Justin Verlander | 434378 | 100.5 | 90.1 | Milton Bradley | 1 |
| 10/24/06 | DET vs STL | 7 | Joel Zumaya | 451491 | 100 | 88.2 | Preston Wilson | 4 |
| 10/24/06 | DET vs STL | 7 | Joel Zumaya | 451491 | 100.7 | 89.4 | Albert Pujols | 1 |
| 10/26/06 | DET vs STL | 8 | Joel Zumaya | 451491 | 100.6 | 90.2 | Aaron Miles | 5 |
| 10/26/06 | DET vs STL | 8 | Joel Zumaya | 451491 | 101.6 | 90.9 | So Taguchi | 1 |
| 10/27/06 | DET vs STL | 1 | Justin Verlander | 434378 | 100.1 | 91.2 | Ronnie Belliard | 4 |
Note on radar readings for these games - radar readings for Verlander on 10/11/06 1st inning reached 101 mph (Pitch F/X said 101.0), and in the 3rd inning reached 103 mph (Pitch F/X says 100.5 was the max for the inning) (r23)
2006 World Series included above
Joel Zumaya and Justin Verlander are the only pitchers to throw 100+ in the 2006 World Series. Zumaya threw four, topping at 101.6 on 10/24/2006. Verlander threw one at 100.1 mph on 10/27/2006.There was no pitch F/X data recorded for the following 2006 postseason games:
- Mets vs. Dodgers series Oct 4 (NY), 6 (NY), 7 (LA)
- Det vs. NYY Oct 3, NYY vs. Det Oct 7
- STL vs. SD Oct 3, SD vs. STL Oct 8
- OAK vs. MIN Oct 3
Standardized Speed Readings - FFE Calculations u3
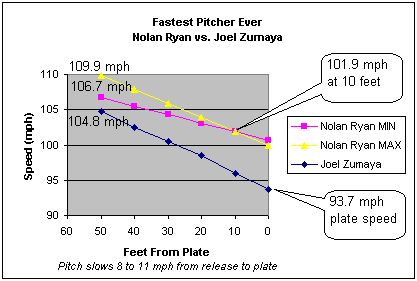
Today's highly accurate PITCH F/X pitch speeds are measured at a point near the pitcher's hand at 50 feet from the plate.(*) Many earlier 'radar' and artillery measuring methods used varying distances along this spectrum to measure the speed of the ball. Therefore, it's not easy to compare, say, Nolan Ryan's well known speed record of 100.9 mph to other pitchers' radar readings, or even today's PITCH F/X speeds.We know that typical pitch speeds drop 8-11 mph (average 9 mph) from 50 ft away to the front of the plate.
So, we make an adjustment, based on the known distance used and an estimated speed drop, to standardize all known pitch speeds to what we refer to as a 'Fifty Foot Equivalent'.
(*) However, according to this blog post at GoRangers,
In the early months [of 2007], they were measuring the release point at 55 feet from the plate. During June, they started measuring it at 40 feet, then later moved it to 50 feet.
Fastest Pitcher Biographies
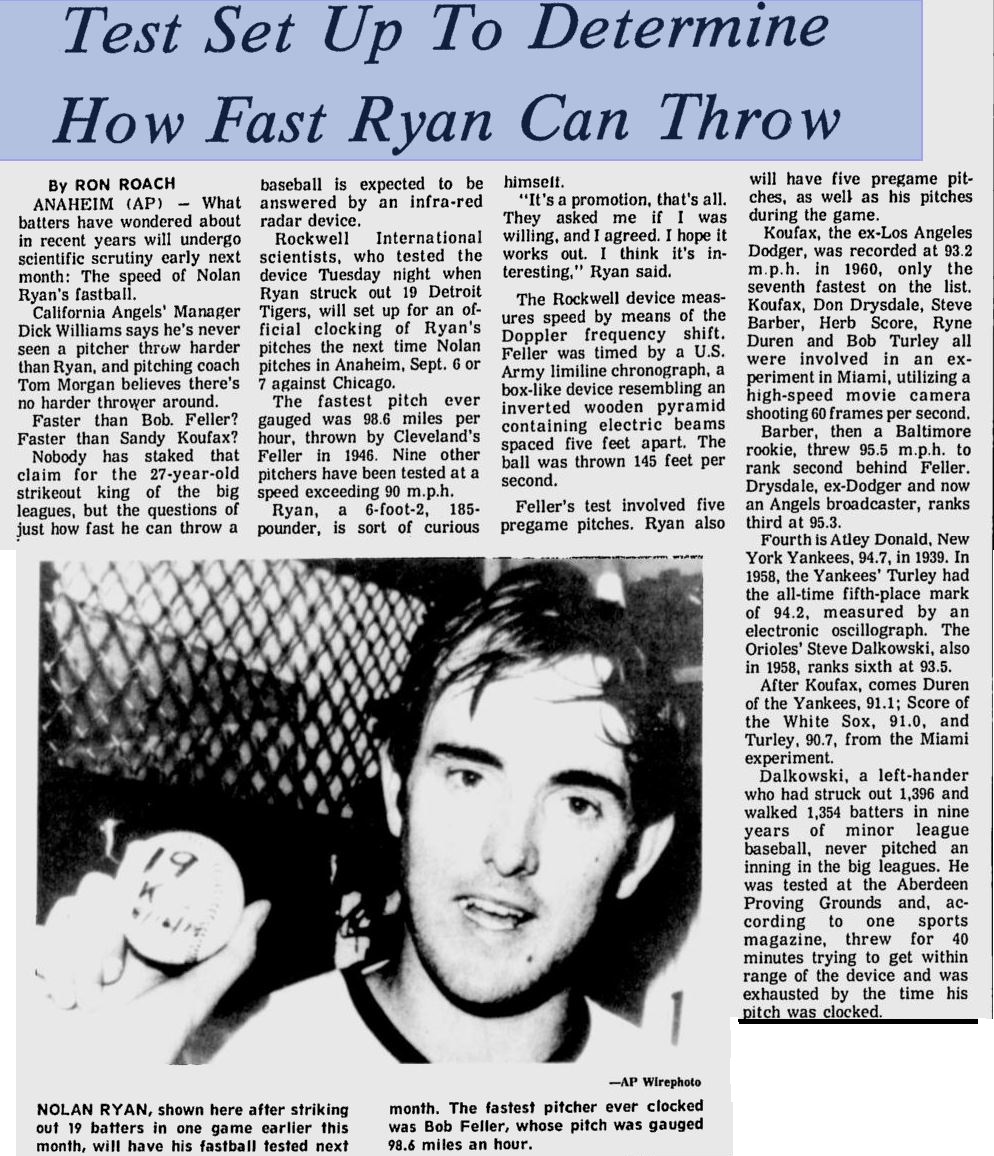
Nolan Ryan - The Fastest - 108.1 mph FFE in 1974 s1 s3 s22 s23
Our best estimate is that Nolan Ryan's pitch on 8/20/1974 (exactly 28 years after Bob Feller's record pitch in 1946) was 108.1 mph FFE using today's standard of measurement at 50 feet from the plate.
Background of the Tests
Nolan Ryan in his 2nd year with the Angels broke Sandy Koufax's record with 383 strikeouts in 1973. The Angels wanted to use their strikeout king to boost sagging attendance for 1974. So in August 1974 George Lederer, the Angels Director of Public Relations and Promotions, and former L.A. Dodgers beat writer for the Long Beach Independent Press-Telegram, began the groundwork for a scientific test to be conducted by Anaheim-based Rockwell International scientists (likely using a coherent laser radar).They tested the device for baseball purposes first on "an asphalt parking lot at the Rockwell International facility in Anaheim, the Rockwell engineers sought to test their device in a dry run before taking it to the stadium for an upcoming Ryan outing" using Charlie Sands, the Angels catcher on the DL, and the LH former high-school pitcher son of George Lederer, Tom.
They decided to get some readings during a live game, then try it again with a big promotional event.
The First Ever Live Speed Test 8/20/1974 - 100.9 mph Records3
The first ever test of pitch speeds during a live game was conducted on Tue. 8/20/1974 in Anaheim Stadium (Angels) vs. the Detroit Tigers.Four Rockwell scientists recorded two of Nolan Ryan's pitches at 100.9 mph.
There were fears about aiming a laser directly at Ryan, so they aimed it from the press box to a point 9-10 feet in front of the plate.
That speed was also 'verified' by the Guinness Book of World Records s1. This Guinness record still stands to this day (although they did not convert the result to FFE).
Only the pitches that passed through an infrared beam 17 inches wide and 2 inches high recorded a reading.s3
The results of this test were not publicly announced until the second test on 9/7 - although Ryan was told the night of 9/6.
Promoting the Speed Test
Since the first test was deemed a big success, the following day on 8/21/1974, the Angels announced to the nation that there would be a second test for the public during an upcoming home game. The Angels decided to have a promotion where fans would get to guess Ryan's fastest speed at that next home game."The Angels are staging a contest in conjunction with the experiment. Fans will have the opportunity to guess Ryan's top speed by sending entries on a postcard to Ryan Express, P.O. Box 3820, Anaheim, CA 92803. Estimates should be made to the nearest one-tenth mile per hour. Entries also should include the number of pitches Ryan will make during the game of Sept. 6 [later changed to Sep 7]. This figure to be used only in case of ties for speed. Postcards must be received by September 5.It would be interesting to know who won each of these prizes. I'll keep looking.
Grand prize will be a trip tor two to the first two games of the American League Championship series in the Western Division City, October 5-6. Other prizes are an Angels desk watch, an Angels pen and pencil set with official emblems, and 25 baseballs autographed by Ryan. Winners need not be present on Sept. 6." s26

8/21/1974 Nationwide


The Public Promotional Event - 9/7/1974
Ryan's fastest pitch in that second game reached 100.8 mph (at 9-10 feet from plate) on 9/7/1974 s1. See chart at right.
OK, How Fast Was It? - The FFE Calculation
Today's pitch speeds are measured from 50 feet away from the plate, but Ryan's was measured at approx. 10 feet. Pitch speeds drop 8-11 mph (average 9 mph) from 50 ft away to the front of the plate. So we must add 6-8 mph to the speed measured by Rockwell in order to be equivalent to today's readings.Therefore, Nolan Ryan's pitching speed as measured today would be at minimum 106 mph and could have been as high as 110 mph.
How did we arrive at 108.1 mph? The facts are 100.9 at 10 feet, plus 9 mph drop per 50 feet. So add 7.2 mph (9/50*40) to 100.9 to get 108.1 mph.
The speed of the ball as it crossed the plate would have been 99.1 mph - calculated as 100.9 at 10 feet less (9/50X10) or 1.8 mph. u3
The Press
In the Sports Illustrated article Speed Trap For An Angel on 9/16/1974 Ron Fimrite reported:As Ryan mowed down the Chicago White Sox 3-1 last Saturday for his 18th win of the season, a team of electronics technicians from Rockwell International fidgeted upstairs in the press box with some complicated radar timing equipment. The results supported Ryan's own contention that he throws harder in the late innings, for his fastest pitch of the night was the third one he threw to the Sox' Bee Bee Richard, who led off the ninth inning. Rockwell timed that high hard one at 100.8 mph, exceeding the 98.6 mph once recorded by Bob Feller with entirely different equipment.
Under less official conditions Ryan had thrown even faster. During an 11-inning game on Aug. 20 in which Ryan fanned 19 Detroit Tigers, the technicians timed two of his pitches at 100.9 miles per hour.
Ryan Was Still Bringing It 14 Years Later s25
In 1988, 14 years after the 1974 tests, when Ryan was 42 years old and in his last year with the Astros, he was still hitting 97 mph, and averaging 93.2 mph.GIFs of Nolan Ryan's Pitching Motion Throughout The Years
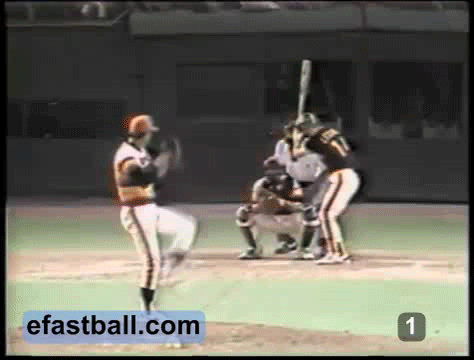
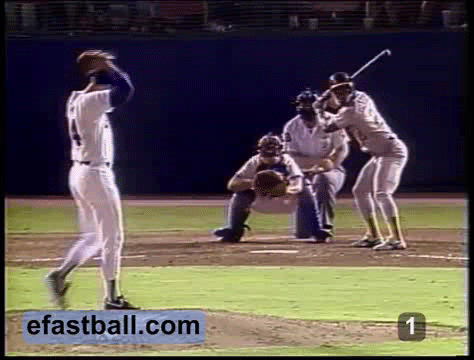
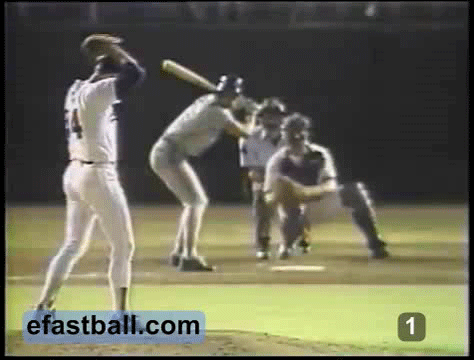
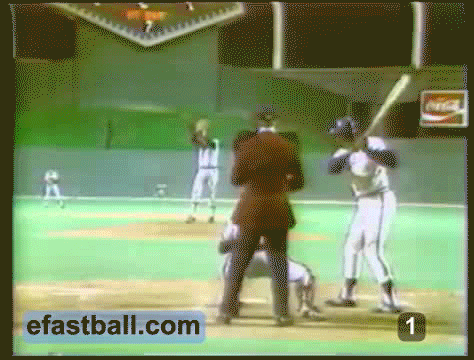
It's interesting to note that all 6 of the above hitters wait much longer to begin their stride than most today.
Bob Feller - 2nd Fastest - 107.6 mph FFE in 1946
The problem was, he never told Feller until he got to the field. So on August 20, 1946, Bob Feller threw approximately 30 pitches in front of 31,000 fans (20,000 more than normal) into a device the newsreels called a "lumiline chronograph" using "photo electric cells".
He pitched from the mound through a v-shaped opening (the first sky screen) in the device located just in front of the plate. The ball then passes through the second sky screen, and the separate chronograph/timer calculates the time/speed between the two screens.
His fastest speed recorded was 98.6 mph on the second throw, but the measurement took place at home plate, or 60.5 feet from the pitchers plate. To compare his speed to others, you must add the average 9 mph speed drop from 50ft to the plate. Therefore, his pitch speed was 107.6 mph at the equivalent 50 ft mark.

Catcher Frankie Hayesu4

From "Now Pitching, Bob Feller" by Bob Feller and Bill Gilbert, 2002, p. 128-129

photo-op only - not real test - notice it's broken
 Daily Sun 8/19/1946")
8/19/1946
Clark Griffith... announced that I would throw some pitches through a special photoelectric measuring device at home plate so my fastball could be clocked in those days before radar guns. He announced the test a week before the Indians came to Washington, and he had a large crowd in his ball park the night of the test. Mr. Griffith came in... He told me it was about time to get out there and start throwing smoke. I told him as soon as he paid me for it. I asked him for $1,000 and settled for $700 before leaving the clubhouse to do it.
For my 700 bucks, I threw several balls through an opening in that photoelectric machine, and 31,000 fans watched almost in silence as they awaited the announcement of the speeds recorded by the machine, which came from Aberdeen Proving Ground in Maryland.
Disputed Speeds24
Some news reports indicated that Feller threw 98.6 mph. Some indicated 145 fps and 98.6 mph. Some indicated 145 fps and 98.8 mph.If you convert 145fps to mph, you get 98.86 mph, not 98.6 mph. So, either the 145fps is rounded and 98.6 is correct. Or the conversion from fps to mph was performed incorrectly from the start. We are going to assume the 98.6 mph is correct since that speed has been reported ever since, and not corrected by anyone. Plus, one press report indicates that he will be timed to '1-10,000 of a second', indicating fps with decimals.
How does that compare to Nolan Ryan?
Ryan's plate speed would have been at least 99 mph (100.9 less 2 mph reduction per 10 feet) and was roughly 0.4 mph faster than Feller's 98.6 mph at the plate.

Bob Feller's Fastball u4
Feller's Speed Test vs. a Motorcycle in Chicago's Lincoln Park 1940 u6
See the event at Cavalcade of Sports Bob FellerLew Fonsecas11 produced a film for the American League, released January 16, 1941s11, where Feller in 1940 threw a ball as a speeding Indian police motorcycle (incorrectly referred to as a Harley in most reports) raced by at 86 mph. s10
How fast was the ball going?
Let's count the video framesThis pitch speed is approx. 93-94 mph out of his hand. The calculation is based on: approx. 10 moving frames from release to 'contact' (two are repeated), at 24fps video, equals approx. 89.2 mph average speed. This calculation assumes, based on Feller's book 'Bob Feller�s Little Blue Book of Baseball Wisdom', that he started 60.5 feet from the target.
Let's use the motorcycle speed
The pitch speed is approx. 103 mph out of his hand. This calculation is based on:
- 1. Plate is 60.5 ft away from the target.
- 2. The motorcycle traveled 47.5 feet during the pitch. It had a 10 ft head start (see photo) before Feller released the ball, and was 3 feet from the target when the ball struck.
- 3. The motorcycle maintained 86 mph during the test.
- 4. So, 86 mph for 47.5 feet lasts .3766 seconds.
- 5. The pitch covering 54.5 feet (after estimated 6 ft. stride) lasting 0.3766 seconds would have been averaging 98.7 mph
- 6. Add 4 mph for speed at release. to get approx. 103 mph.


Aroldis Chapman - 3rd Fastest - 105.1 mph in 2010
The Cincinnati Reds' Aroldis Chapman threw 105.1 mph (96.5 mph plate speed) on 9/24/2010 in the 8th inning against Tony Gwynn, Jr. of the San Diego Padres. The slowest pitch he threw in the 8th inning was 99.6 mph.

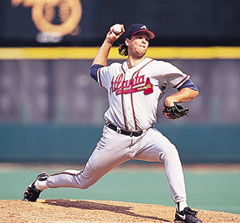
Joel Zumaya - 4th Fastest - 104.8 mph in 2006


The Detroit Tiger's Joel Zumaya threw 104.8 mph (93.7 mph plate speed) on 10/10/2006 in a post-season game (the first game in the American League Championship series where they beat Oakland 5-1) at McAfee Coliseum in Oakland. It was 63° with the wind blowing left to right when the game started. Oakland's Frank Thomas was the 2nd batter he faced in the 8th inning. The record-breaking throw was the 3rd pitch on a 1-1 count and was thrown outside for a ball.
This was measured at 45-50 feet away from the plate using MLB's very accurate gameday video system that is in use today.
How does that compare to Nolan Ryan?
Ryan's plate speed would have been at least 99 mph (100.9 less 2 mph reduction per 10 feet) and was roughly 5 mph faster than Zumaya's 93.7 mph at the plate.
June 2009 - 102.7 mph
Zumaya threw another 102.7 mph pitch on 6/30/2009 in the 7th inning against Oakland's Matt Holliday for a foul tip on a 3-2 count.
June 23, 2006 104 mph radar
Several sources indicate that Zumaya threw a pitch on 6/23/2006 in the 10th against the Cardinals which registered 104 mph on stadium radar - 4 others were 100+. We are told the announcer said the reading could not have been right (haha).Understanding Pitch Speed Measurements
Most important - Where was the pitch measured?
A 100 mph fastball pitch will lose 8-11 mph (average 9 mph) from just out of the pitchers hand (50 feet way) until it reaches the front of the plate.Was the measurement taken at the plate? 50 feet away? Most confusion over comparing pitch speeds arises over this issue.
Radar guns can provide fastest speed, slowest speed and average speed. So, on a 100 mph pitch a gun could provide readings of 100, 91 and 96 mph on the same pitch. Different parks and venues display different readings.
Where along the flight path was the fastest speed measured? Nobody knows. So, it's possible a radar gun could provide a slower than actual reading if the gun caught the ball closer to the plate.
However, a radar gun should not provide a reading that is too high (except for rounding up), regardless of what you read in blogs and articles.
How accurate is MLB Enhanced Gameday (PITCH F/X) pitching speed? When did Pitch F/X begin?
Very accurate. There is no more accurate system for measuring pitch speed.The MLB Enhanced Gameday system (and Pitch F/X) was started during the 2006 postseason. On opening day April 1,2 and 3, 2007 every park was publishing very basic data, but only the White Sox, Seattle, and Anaheim had detailed speed data. By the end of 2007, they rolled out the system to 28 of the 30 parks, but it is said that only about 1/3 of the total games are included. At the start of the 2008 season, all 30 ballparks had this capability. s2
MLB began tracking data for any exhibition (spring training) games played in MLB parks beginning in the 2008 season. 2008 dates include exhibition games only in home parks on March 28, 29 and 30. 2009 dates include March 15,16,17,19 plus April 2,3,4. Beginning the Spring Training 2010 season, certain (maybe most?) spring training fields had Pitch F/X capabilities.u10
This system does not use radar guns. Each park's system utilizes 2 high speed video cameras (60 frames per second), a setup crew to layout a grid before each game, and a crew in the truck sizing up each batter, pitcher and pitch using computer software. See Dr. Alan Nathan's Guide to Pitch F/X - by Mike Fast.
This system provides 2 different speed stats - 50 feet from the plate and just in front of the plate.
Radar Guns
Related: The History of Radar GunsStadium Radar Gun Displays


Radar Guns should theoretically only give slower readings not faster readings
The gun may give a slower reading if the angle of the gun is not the same angle as the pitched ball. The bigger the difference, the slower the reading.
The biggest confusion over gun readings is where the reading is taken from (how far is the ball from the plate?). Was the reading out of the pitcher's hand, over the plate, or somewhere in the middle? Some guns pick up the fastest speed, some pick up the speed at 15 feet out of the hand, some over the plate, etc. Obviously, the ball will be fastest right out of the pitcher's hand and will slow down as much as 11 mph as it approaches the plate.
Given the above, it is unlikely that a radar gun would ever provide a reading that is over 2 mph too high.
However, there would be inconsistencies between parks as the gun may be shooting at different plate distances.
Coherent Laser Radar (Doppler)
From Tom Lederer in Remembering the Ryan Express in Baseball Analysts quotes the 9/2/1974 LA Times article by Dan Hafner giving a preview of the 9/7 event:A device called a coherent infrared radar, developed by Rockwell International, will measure the velocity of Ryan's fastball. Other devices have clocked nine other major league fireballers and the fastest of the nine was Bob Feller, at 98.6 m.p.h. in 1946. The Cleveland star was 27, Ryan's age now.
But the comparison will be exact. Rockwell International calls its device the most sophisticated ever used to measure the speed of a thrown baseball.
The machine will operate from the press box, making use of a phenomenon called the Doppler frequency shift.
The infrared beam from a low-power transmitter is aimed at a spot 9 or 10 feet in front of home plate. Because infrared wave lengths are 20 times longer than those of visible light waves, the beam cannot be seen.
As the ball crosses the beam, the waves are compressed by the motion of the ball and reflected back to the equipment. The returning waves have less spacing between them than when they were transmitted. The device measures that difference to determine the ball's speed.
There's no guarantee that Ryan's fastest pitch will be timed. The narrower the beam, the more accurate the measurement, so the beam will be narrowed to the width of home plate. Ryan, who is sometimes wild, may miss it with his best throw.
Radar Gun Era (1975 on)
Related: The History of Radar Guns100+ mph Pitchers Measured with Radar Guns
Only pitchers that were measured and documented are listed
2007 Radar (partial year - see Pitch F/X section for more 2007 pitches)
- 102 Matt Lindstrom r3r25, 5/16/2007, PNC Park (Pirates), Pittsburgh, 8th inning (no Pitch F/X speed data on that day)
- 102 Justin Verlander r3r4, 6/12/2007, Comerica Park (Tigers), Detroit, 9th inning of a no-hitter (no Pitch F/X speed data on that day)
- 101 Jonathan Broxton r3 r4, 6/26/2007, Chase Field (DBacks), Arizona
- 101 Joba Chamberlain r3, 8/24/2007, Comerica Park (Tigers), Detroit
- 101 Seth McClung r3r4, 8/21/2007, Chase Field (DBacks), Arizona
- 101 Tony Pena r3, 6/7/2007, AT&T Park (SF Giants), San Fran
- 100 Ubaldo Jimenez r3r4, 9/10/2007, Citizens Bank Park (Phillies), Phila.
- 100 Radhames Liz r3r4, 8/25/2007, Oriole Park (Orioles), Baltimore
- 100 Rafael Soriano r3r4, 5/4/2007, Turner Field (Braves), Atlanta
- 100 Joel Zumaya r13, 4/10/2007 8th inning Orioles' Corey Patterson homered on his 2nd pitch (no Pitch F/X that day)
From 2002-2006, Baseball Info Solutions tracked stadium radar gun readings and they were annually recapped in the Bill James Handbook
2006 Radar
There were 335 pitches thrown 100+ in 2006. Joel Zumaya threw 233 of those.r1- 104 (233) Joel Zumaya, Tigers r8r9 2006 season
- 102 (3) Brad Lidge, Astros r8r9, 2006 season
- 102 (1 or 2) Mark Lowe, Marlins rookie reliever r8r9r11 , 8/2/2006 8th inning vs Ramon Hernandez at Camden Yards in 102 degree heat (on 8/20/2006 he went on DL and ended up with TJ surgery)
- 102 (1) Jeremy Accardo r8r9, 2006 season
- 101 (26) Kyle Farnsworth, Yankee r8r9 2006 season
- 101 or more (19) Justin Verlander, Tigers r8r9r15 , 4/23/2006 vs Mariners' Richie Sexson 1st inning
- 101 (3) Bobby Jenks, White Sox r8r9, 2006 season
- 101 (1) David Aardsma, Cubs r8r9, 2006 season
- 101 (1) Daniel Cabrera, Orioles r8r9, 2006 season
- 101 (1) Manny Delcarmen, Red Sox r8r9, 2006 season
- 101 (1) Mark Lowe, Mariners r8r9, 2006 season
- 101 (1) Joe Nathan, Twins r8r9, 2006 season
- 101 (1) Francisco Cordero, Brewers r8r9, 2006 season
- 101 (1) Seth McClung, Rays r8r9 2006 season
- 100 (5) Ambriorix Burgos, Royals r8r9, 2006 season
- 100 (5) Billy Wagner, Mets r8r9, 2006 season
- 100 (3) Denny Bautista, Rockies r8r9, 2006 season
- 100 (1) Jeremy Affeldt, Royals r8r9, 2006 season
- 100 (1) Francisco Cordero, Rangers r8r9, 2006 season
- 100 (1) Jorge Julio, DBacks r8r9, 2006 season
- 100 Brandon League, Blue Jays r3, 7/14/2006, Rogers Centre, Toronto
- 10? (7) Felix Hernandez, Mariners r8r9, 2006 season
- 10? (5) Matt Thornton, White Sox r8r9, 2006 season
- 10? (3) Derrick Turnbow, Brewers r8r9, 2006 season
- 10? (3) Robert Novoa, Cubs r8r9, 2006 season
- there are 8 100+ pitches missing (likely 8 different pitchers)
Note - Mark Lowe is listed at 101 per BISr8, but r11 shows 102 mph - not sure if that is on a different day or the same pitch
2005 Radar
There were 134 pitches thrown 100+ in 2005. Daniel Cabrera threw 37 of those.r1- 102 (10) Bobby Jenks, White Sox r3r7r20, 8/27/2005, Safeco Field (Mariners), Seattle (103 mph in Winter ball r19)
- 101 (17) A.J. Burnett, Marlins r3r7, 5/31/2005 (see Note below), PNC Park (Pirates), Pittsburgh, and r24 again on 4/12/2005 Dolphin Stadium vs. Phillies
- 101 (?) Brandon League, Blue Jays r13 8/19/2005 Chris Shelton hit a home run on the 4th inning pitch
- 10? (37) Daniel Cabrera, Orioles r7
- 10? (18) Billy Wagner, Phillies r7
- 10? (15) Kyle Farnsworth, Tigers/Braves r7
- 10? (11) Seth McClung, Devil Rays r7
- 100 Rich Harden r3, 5/13/2005, McAfee Stadium (A's), Oakland
- 100 Dustin McGowan r3r4, 10/2/2005, Rogers Centre (Blue Jays), Toronto
- 100 Derrick Turnbow r3, 5/27/2005, Miller Park (Brewers), Milwaukee
- 100 Kerry Wood r3r4, 8/10/2005, Wrigley Field (Cubs), Chicago
- there are 21 missing 100+ pitches (likely 21 different pitchers)
2004 Radar
There were 82 pitches thrown 100+ in 2004. Kyle Farnsworth threw the most at 30. r1- 102 Randy Johnson r3, 7/9/2004, Pac Bell Park (SF Giants), San Fran
- 102 Josh Beckett, Marlins r21, 4/17/2004, vs. Braves in Atlanta
- 101 (30) Kyle Farnsworth r1r2r3f , 5/26/2004, Minute Maid Park (Astros), Houston
- 101 or more (8) Billy Wagner, Phillies r2r14 , 4/16/2004 vs. Expos 9th inning during one of the 2 strikeouts (he threw 4 100+ pitches in that game)
- 101 Eric Gagne r3, stadium reading 4/16/2004, 9th inning vs. Barry Bonds 6th pitch (Bonds hit it foul into the water) in SBC (now AT&T) Park (SF Giants), San Fran (Bonds hit his 662nd home run on the next pitch - 100mph)
- 100 Jorge Julio r3, 9/16/2004, Skydome (Blue Jays), Toronto - and again in 2006 r8
- 100 Ben Sheets r3, 7/10/2004, Miller Park (Brewers), Milwaukee
- 10? (8) Jesus Colome r5
- 10? (4) A.J. Burnett r2
- 10? (2) Edwin Jackson r2
- there are 25 missing 100+ pitches
2003 Radar
There were 204 pitches thrown 100+ in 2003. Billy Wagner threw 159 of those. r1- 101 (159) Billy Wagner, Astros r1r3r4 , 7/30/2003, Turner Field (Braves), Atlanta (122 of his 100+ mph pitches were at home r7)
- 10? (12) Bartolo Colon, White Sox r6
- 10? (8) Kyle Farnsworth r6
- 10? (4) Jorge Julio r6
- 100 (3) Josh Beckett r3r6 , 10/12/2003, Pro Player Park (Marlins), Miami
- 10? (3) Jesus Colome r6
- 10? (2) Francisco Cordero r6
- 10? (2) Tom Gordon r6
- 10? (2) Braden Looper r6
- there are 9 missing 100+ pitches (likely 9 different pitchers)
2002 Radar
There were 106 pitches thrown 100+ in 2002. Billy Wagner threw 42 of those.r1- 102 Armando Benitez r3, 5/24/2002, Shea Stadium (Mets), NYC
- 101 Guillermo Mota r3, 7/24/2002, Qualcomm Stadium (Padres), San Diego
- 100 C.C. Sabathia r3, 6/28/2002, Jacobs Field (Indians), Cleveland
- 100 Bartolo Colon, Indians r13, 5/9/2002 (Mike Sweeney hit a home run off of it - 6th or 8th inning)
- 10? (42) Billy Wagner, Astros r1, 2002 season (26 of his 100+ mph pitches were at home r7)
- there are 60 missing pitches from this list
Radar - pre 2002
vs. Jim Thome
- 102 (6 or more) Robb Nen, Marlins r17 , twice on 10/18/1997 World Series Game 1, 9th inning vs Indians' David Justice (who pulled it for a hit) , and again to strike out Jim Thome, Pro Player Stadium (Marlins), Miami
- 101 Rob Dibble r3, 6/8/1992, Candlestick Park (SF Giants)
- 101 Jose Mesa r3, 5/1/1993, Cleveland Stadium (Indians)
- 100 Bartolo Colon r3, 10/6/1999, Jacobs Field (Indians), Cleveland
- 100 Roger Clemens r3, 10/10/2001, Yankee Stadium, New York
- 100 J.R. Richard r3, 5/25/1976, Candlestick Park (SF Giants), San Francisco
- 100 Dwight Gooden r3, 6/17/1990 Three Rivers Stadium
- 100 Billy Wagner, Astros r16, Sunday 8/9/1998 9th inning vs Doug Glanville (Phillies) in the Astrodome
Mark Wohlers - 8th Fastest - 103 mph in 1995
Mark Wohlers threw 103 mph several times on the stadium radar gun during a March 1995 Spring Training Game against the Marlins in Joe Robbie Stadium.r18Wohlers also has a confirmed pitch of 101 mph on 7/5/1995 9th inning vs Dodgers in Atlanta r22
The fastest pitch that Wohlers threw in the 1995 World Series was in Game 3 10/24/95 9th inning vs the Indians' Albert Belle 100 mph, 2nd pitch. r26
Radar Gun Rumors
 There are rumors in articles of other pitchers that have been gunned at 100+. But, until I find harder evidence for these events, I won't list them.
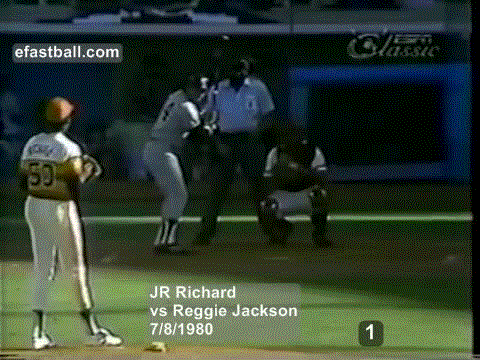
- JR Richard at 101 (vs 100 above) and again here. In the 1st inning of the 1980 All Star game, the announcer said he threw a 94 mph slider to Reggie Jackson (see GIF at right).
- JR Richard also threw at least 101 mph somewhere, but it's not clear when or exactly how fast, in this ESPN clip
at the 1:50 mark in what appears to be the 1980 All Star game, Keith Jackson says
and that ladies and gentlemen, was a fastball that was better than 100 miles an hour
- Billy Koch at 101 or 100 mph
- Brad Penny at 101 mph per MLB.com in 2007 "Penny hit 101 mph with his fastball at times, according to the Chase Field radar gun"
- Jesus Colome reportedly threw 101 mph for the Devil Rays in 2000
- Mark Kroon reportedly threw a Japanese record 101 mph in 2008
- Lee Smith, Cardinals reliever according to Paul Votano's book, Late and Close: A History of Relief Pitching, page 107, reportedly was 'clocked at 101mph'
- Bobby Jenks 2003 threw 103 in Winter ball, but when? see r19
- Billy Wagner 2003 threw two additional 101 mph pitches on what I derive to be 7/11/2003 Astros vs. Pirates 9th inning striking out someone with 101 on 3rd and 4th pitch
per a Phillies forum
First pitch .... 100 MPH!!!, second pitch ...100 MPH, third pitch ..... 101 MPH!!!, fourth pitch 101 MPH!! Sit Down Pal!
- Francisco Cordero 100 mph 2004 - per Mark Newman's MLB article
Pitchers packing powerful heat (it doesn't mention a specific game)
Francisco Cordero has been nearly automatic for the Rangers, giving him entr�e into baseball's newly elite among closers, going under 95 mph only on breaking balls and topping out at 100.
- Eric Gagne 102 mph 4/2004 - per Mark Newman's MLB article about a 4/16/2004 game
Pitchers packing powerful heat (it doesn't mention a specific game)
Giants reliever Matt Herges said Gagne also hit 102 in the [Dodgers-Giants] series
This youtube shows Gagne vs Bonds 4/16/2004 with the 101 mph pitch going into McCovey Cove foul. - Troy Percival 102 mph 9/20/2001 - Mike DiGiovanna's 8/21/2001 article Glaus Enjoys a Rare Good Day in Safeco
I saw [Percival] hit 102 mph and me 97 mph; all I can say is that gun is accurate as any in the league," Washburn joked.
- A.J. Burnett 102 mph June 2004 - Burnett Jockbio page says
A.J. worked hard during his rehab and returned in June of 2004 throwing an astonishing 102 mph. His control was better, too.
Bill Gutman's 2010 book Yankees by the Numbers saysBurnett had Tommy John surgery in 2003, yet returned the next year to throw a fastball at 102mph. In 2005, his fastball averaged 95.6 mph, best in the league.
- Jim Kerns White Sox, 100 mph 1970s/80s
- Maels (pronounced Miles) Rodriguez became the first in Cuban National League history to throw 100 mph in a game on 12/8/1999 (Chapman broke his record in 2008 at 101.2 mph), two weeks later he threw the league's first ever perfect game, then he threw 100 mph again in the Summer 2000 Olympic Games for Cuba. He worked out for 15 MLB teams on 1/22/2004, but no offers materialized after he couldn't hit 90 on the gun (after his 2002 arm injury). He was drafted in 2005 by the Diamondbacks but never played. So, even though he hit 100 mph, he never actually played for the MLB in any capacity.
Pitch Speed Tests Before Radar Guns - 1912 to 1974u11
Only pitches that were measured and documented are listed below.Everybody Loves Speed
The speed of pitched balls has been of intense interest since the earliest days of baseball. Team owners and newsmen have long known that the public has a thirst for fastball speeds. The world's first speed test in 1912 of Walter Johnson and Nap Rucker became a sensation and made headlines all over the country.Baseball pitches were measured using a variety of methods by the US Army ballistics/artillery labs, West Point, time and motion engineers, and engineering firms:
- Chronographs with various screen devices - called 'lumiline', 'photo-electric pitching meters', 'gravity drop interval recorders', 'DuMont cathode-ray oscilloscope [with a] photoelectric eye'
- High speed and low speed video cameras
- Racing against a speeding motorcycle
- Early 'coherent laser radar'
Demystifying Chronographs and Screens
the two triangles are the 'screens'
These devices are generally comprised of two 'screens', and a chronograph.
The chronograph, or its cousin the oscilloscope/oscillograph, is like a stopwatch/timer used to measure the start and stop times. But it needs two or more 'screens' to tell it when to start and stop as the object passes through the screens.
The screens are the start and end points and are usually called 'sky screens', 'lumiline screens', or 'make or break' screens and look like the triangle-shaped devices seen in pictures on this page. Some early screen devices used small copper wires in the opening and a steel plate for the end point.
Screens usually work using a photoelectric beam, just like your home burglar alarm sensors, your garage door sensor, or an elevator door sensor. When something crosses the light beam, it triggers some action.
When the ball (or bullet) passes through the starting point, it begins the timer, then the object passes through or hits the end point, which stops the timer. The distance between the start and end points are known, so its easy to calculate the speed in terms of feet per second (fps) of the moving object/ball/bullet/missile.
Here is a link to an interesting 1982 document from US Army Aberdeen Proving Ground, MD that "describes methods for measuring projectile velocity, including time of flight distance measurements, and equipment.". Sec 2.2 Instrumentation List includes: "Sky screens and chronographs, lumiline screens and chronographs, make or break screens and chronographs, can test velocity to 3000 m/s with +-0.1%" maximum error. So, these devices are very accurate.
Accuracy
Oehler Model 57 Photoelectric Screens
Radar and chronograph devices work mostly the same way in that a timer starts, then something causes the timer to end, and you know the distance between the start/end points (radar uses different wave lengths, and chronographs use the sky screen openings - ex. the triangle shaped box).
However, with radar (even with the best Stalker/JUGS gun), you don't know exactly where, along the path taken from pitchers hand to the plate, the reading was taken - was it measured out of the hand? 10 feet away? 12 feet away? There is no way to know. With the chronograph device, you know the precise location of the measurement since it's based on the physical location of the device itself.
Why Did Portable Radar Guns Overtake Chronographs for Pitch Speed Tests?
The reason that radar overtook chronographs in measuring pitch speeds is not because radar is more accurate, but because radar is more practical, in that a ball no longer had to be thrown through a device. Radar allowed a game to be played, and measurements to be taken, during a live game, which means that every pitch could be measured, not just a few warmup pitches before the game started.But, this practicality led to continued confusion during the 30 years of the radar era, from 1975 through 2006, because of 'fast guns' (with readings taken near the pitchers hand) , 'slow guns' (readings averaged, or taken near the plate) , and other radar guns/devices where you had no idea where the ball was along the path when the measurement was taken.
50 Foot Equivalent for Comparing Pitch Speeds Across Eras
I have calculated the 50 foot equivalent (FFE) speed for each pitcher, based on how far they were from the device, and what type of device, so they can be compared to each other, and to today's speeds.List of All Recorded Pitch Speed Test Results - 1912-1974
| FFE | Name | Tested Speed | Method | Tested distance | When | Where | Device | Comment |
|---|---|---|---|---|---|---|---|---|
| 108.1 | Nolan Ryan | 100.9 mph (twice) | Early radar | 10 ft from plate | 08/20/74 | Anaheim Stadium during game, in press box | Rockwell Intl coherent infrared laser radar | 1st test with Guinness |
| 108.0 | Nolan Ryan | 100.8 mph | Early radar | 10 ft from plate | 09/07/74 | Anaheim Stadium during game, in press box | Rockwell Intl coherent infrared laser radar | 2nd test for public |
| 107.6 | Bob Feller | 98.6 mph | lumiline chronograph | plate | 08/20/46 | Griffith Stadium Washington DC, home plate | Portable lumiline chronograph using photo electric cells from ordnance plant at Aberdeen, MD | |
| 103.2 | Bob Turley | .00362/6in-138.12fps-94.17 mph | oscillograph | 60.5 feet, device at plate | 05/12/54 | Baltimore Stadium, home plate | Dumont Labs cathode-ray oscillograph | added to 102+ list 10/7/2014 |
| 102.5 | Steve Dalkowski | 93.5 mph | lumiline chronograph | plate | Jun 1958 | US Army Aberdeen Proving Ground, MD | US Army Aberdeen Proving Ground lumiline chronograph | |
| 102.2 | Joe Black | 93.2 mph | oscillograph | 60 feet 6 inches, device at plate | 09/20/53 | Ebbets Field, Brooklyn NY | Dumont Labs cathode-ray oscillograph | added to 102+ list 10/5/2014 |
| 102.1 | Terry Forster (White Sox) | 94.9 mph | Early radar | 10 ft from plate | 09/07/74 | Anaheim Stadium during game, in press box | Rockwell Intl coherent infrared laser radar | 2nd Ryan test for public |
| 100.1 | Steve Barber | 95.55 mph | 50fps camera | counted frames, avg speed | Spring 1960 | Miami? | 50fps camera | |
| 99.8 | Don Drysdale | 95.31 mph | 50fps camera | counted frames, avg speed | Spring 1960 | Miami? | 50fps camera | |
| 99.3 | Atley Donald | 139 fps/ 94.77 mph | photoelectric chronograph | 20 ft away | 08/30/39 | Cleveland Stadium, side of field | Rex D. McDill's Cleveland Speed Meter � photoelectric chronograph | |
| 99.3 | Rudy York | 139 fps/ 94.77 mph | photoelectric chronograph | 20 ft away | Summer 1939 | Cleveland Stadium, side of field | Rex D. McDill's Cleveland Speed Meter � photoelectric chronograph | |
| 99.3 | Ralph Kress | 139 fps/ 94.77 mph | photoelectric chronograph | 20 ft away | Summer 1939 | Cleveland Stadium, side of field | Rex D. McDill's Cleveland Speed Meter � photoelectric chronograph | |
| 99.3 | Roy Cullenbine | 139 fps/ 94.77 mph | photoelectric chronograph | 20 ft away | Summer 1939 | Cleveland Stadium, side of field | Rex D. McDill's Cleveland Speed Meter – photoelectric chronograph | |
| 98.1 | Mickey Lolich (Tigers) | 90.9 mph | Early radar | 10 ft from plate | 08/20/74 | Anaheim Stadium during game, in press box | Rockwell Intl coherent infrared laser radar | 1st Ryan test |
| 97.7 | Sandy Koufax | 93.20 mph | 50fps camera | counted frames, avg speed | Spring 1960 | Miami? | 50fps camera | |
| 97.6 | Jack Kucek (White Sox rookie) | 90.4 mph (twice) | Early radar | 10 ft from plate | 09/07/74 | Anaheim Stadium during game, in press box | Rockwell Intl coherent infrared laser radar | 2nd Ryan test for public |
| 97.5 | Johnny Podres | 88.5 mph | oscillograph | 60 feet 6 inches, device at plate | 09/20/53 | Ebbets Field, Brooklyn NY | Dumont Labs cathode-ray oscillograph | |
| 96.7 | Dee Miles | 136 fps/ 92.7 mph | photoelectric chronograph | 20 ft away | Summer 1939 | Cleveland Stadium, side of field | Rex D. McDill's Cleveland Speed Meter � photoelectric chronograph | |
| 95.7 | Ryne Duren | 91.16 mph | 50fps camera | counted frames, avg speed | Spring 1960 | Miami? | 50fps camera | |
| 95.6 | Herb Score | 91.08 mph | 50fps camera | counted frames, avg speed | Spring 1960 | Miami? | 50fps camera | |
| 95.4 | Walter Johnson | 134 fps/ 91.4 mph | gravity drop interval recorder | ? | 1917 | Remington Arms lab, Bridgeport CT | gravity drop interval recorder | |
| 95.3 | Bob Turley | 90.75 mph | 50fps camera | counted frames, avg speed | Spring 1960 | Miami? | 50fps camera | |
| 94.0 | Bob Feller | 10 frames | motorcycle and 24fps? video | 60 feet 6 inches | 1940 | Chicago street in Lincoln Park | motorcycle and 24fps video | |
| 93.3 | Steve Sundra | 131 fps/ 89.3 mph | photoelectric chronograph | 20 ft away | Summer 1939 | Cleveland Stadium, side of field | Rex D. McDill's Cleveland Speed Meter � photoelectric chronograph | |
| 93.3 | Wally Moses | 131 fps/ 89.3 mph | photoelectric chronograph | 20 ft away | Summer 1939 | Cleveland Stadium, side of field | Rex D. McDill's Cleveland Speed Meter � photoelectric chronograph | |
| 92.5 | Bob Milliken | 83.5 mph | oscillograph | 60 feet 6 inches, device at plate | 09/20/53 | Ebbets Field, Brooklyn NY | Dumont Labs cathode-ray oscillograph | |
| 90.6 | Johnny Humphries | 127 fps/ 86.6 mph | photoelectric chronograph | 20 ft away | 06/06/39 | Cleveland Stadium, side of field | Rex D. McDill's Cleveland Speed Meter � photoelectric chronograph | |
| 90.6 | Christy Mathewson | 127 fps/ 86.6 mph | gravity drop interval recorder | ? | 1917 | Remington Arms lab, Bridgeport CT | gravity drop interval recorder | |
| 88.5 | Smokey Joe Wood | 124 fps/ 84.5 mph | gravity drop interval recorder | ? | 1917 | Remington Arms lab, Bridgeport CT | gravity drop interval recorder | |
| 87.7 | Walter Johnson | 122 fps/ 83.2 mph | chronograph | 10/06/12 | Remington Arms bullet testing range | chronograph with copper wires and a steel plate | How far away? 20/60ft? | |
| 87.2 | Jimmy Foxx | 122 fps/ 83.2 mph | photoelectric chronograph | 20 ft away | 06/06/39 | Cleveland Stadium, side of field | Rex D. McDill's Cleveland Speed Meter � photoelectric chronograph | |
| 87.2 | Jim Tabor | 122 fps/ 83.2 mph | photoelectric chronograph | 20 ft away | 06/06/39 | Cleveland Stadium, side of field | Rex D. McDill's Cleveland Speed Meter � photoelectric chronograph | |
| 87.2 | Roger Cramer | 122 fps/ 83.2 mph | photoelectric chronograph | 20 ft away | 06/06/39 | Cleveland Stadium, side of field | Rex D. McDill's Cleveland Speed Meter � photoelectric chronograph | |
| 86.0 | Van Mungo | 113 fps/ 77.0 mph | ? | June 1933 | West Point Ballistics lab | ? | ||
| 85.1 | Bob Feller | 119 fps/ 81.1 mph | photoelectric chronograph | 20 ft away | 06/06/39 | Cleveland Stadium, side of field | Rex D. McDill's Cleveland Speed Meter � photoelectric chronograph | |
| 85.1 | Ben Chapman | 119 fps/ 81.1 mph | photoelectric chronograph | 20 ft away | 06/06/39 | Cleveland Stadium, side of field | Rex D. McDill's Cleveland Speed Meter � photoelectric chronograph | |
| 85.1 | Julius Solters | 119 fps/ 81.1 mph | photoelectric chronograph | 20 ft away | 06/06/39 | Cleveland Stadium, side of field | Rex D. McDill's Cleveland Speed Meter � photoelectric chronograph | |
| 85.1 | Jim Shilling | 119 fps/ 81.1 mph | photoelectric chronograph | 20 ft away | 06/06/39 | Cleveland Stadium, side of field | Rex D. McDill's Cleveland Speed Meter � photoelectric chronograph | |
| 84.7 | Lefty Gomez | 111 fps/ 75.7 mph | ? | June 1933 | West Point Ballistics lab | ? | ||
| 81.5 | Nap Rucker | 113 fps/ 77.0 mph | chronograph | 10/06/12 | Remington Arms bullet testing range | chronograph with copper wires and a steel plate | How far away? 20/60ft? | |
| ?? | Billy Loes | ?? | oscillograph | 60 feet 6 inches, device at plate | 09/20/53 | Ebbets Field, Brooklyn NY | Dumont Labs cathode-ray oscillograph | |
| ?? | Ben Wade | ?? | oscillograph | 60 feet 6 inches, device at plate | 09/20/53 | Ebbets Field, Brooklyn NY | Dumont Labs cathode-ray oscillograph | |
| ?? | Lou McEvoy | 150 fps/ 102.27 mph | ? | 05/23/30 | West Point Ballistics lab | ? |
Rumors
- Jim Maloney (Reds) 1965 99.5 mphs20 when? where? device?
1974 Speed Test – Ryan s1 s22 s23
See Ryan bio section for more details of the two games, the promotion of the contest, and the testing.First Live Test During the Angels-Tigers Game 8/20/1974 – Ryan's record 100.9 mph, 108.1 FFE
On 8/20/1974 both Ryan and Lolich (Tigers) pitched complete games over 11 innings. Ryan struck out 19 batters, with no run support to lose 1-0.Earlier, on 6/14/1974, he had struck out 19 Red Sox batters in 13 innings using 235 pitches, resulting in a no decision.
Second test – Live Promotional Event During the Angels-White Sox Game 9/7/1974 – 100.8 mph, 108.0 FFE
On 9/7/1974, Ryan threw 159 pitches, striking out 9 batters, and faced Jack Kucek the White Sox rookie.Terry Forster (White Sox LH reliever) pitched the final 1.2 innings (7th/8th), there is no mention of his speed in the same articles, but he was reported months later to have thrown 94.9 in 'September 1974', so I am going to assume it was on 9/7. Forster led the AL that year with 24 saves, then he injured his arm in 1975.
(However, I am not including Forster's speed on the 102+ list until I get more verification of the reading) s21
Speed Results for Both Tests
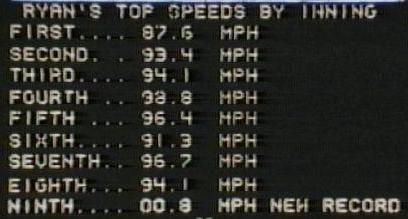
Assuming they were 10 feet away – add 7.2 mph (9mph/50*40) to get to the 50ft FFE – and deduct 1.8 mph (9/50*10) to get plate speed:- Nolan Ryan (Angels) 8/20/74, 100.9 mph at 10 ft away, or 108.1 mph FFE, 99.8 mph est. plate speed, 1st inning vs. Tigers' Ron LeFlore (he threw two 100.9 pitches that game)
- Nolan Ryan (Angels) 9/7/74, 100.8 mph at 10 ft away, or 108.0 mph FFE, 99.7 mph est. plate speed, 9th inning vs. White Sox' Lee "Bee Bee" Richard
- Mickey Lolich (Tigers) 8/20/74, 90.9 mph at 10 ft away, or 98.1 mph FFE, 89.1 mph est. plate speed
- Jack Kucek (White Sox rookie RHP) 9/7/74, 90.4 mph at 10 ft away, or 97.6 mph FFE, 88.6 mph est. plate speed (he threw 90.4 twice during the game)
- Terry Forster (White Sox reliever) 9/7/74, 94.9 mph at 10 ft away, or 102.1 mph FFE, 93.1 mph est. plate speed
Other Nolan Ryan pitches reported on 9/7/1974:
- Warmup – 88.5 mph at 10ft, 86.7 mph plate speed, 95.7 mph FFE (warmup readings 68.5, 55, 88.5 and 70.7 mph)
- Inning 1 – 87.6 mph at 10ft, 85.8 mph plate speed, 94.8 mph FFE
- Inning 2 – 93.4 mph at 10ft, 91.6 mph plate speed, 100.6 mph FFE
- Inning 3 – 94.1 mph at 10ft, 92.3 mph plate speed, 101.3 mph FFE
- Inning 4 – 98.8 mph at 10ft, 97.0 mph plate speed, 106.0 mph FFE vs. Jerry Hairston
- Inning 5 – 96.4 mph at 10ft, 94.6 mph plate speed, 103.6 mph FFE
- Inning 6 – 91.3 mph at 10ft, 89.5 mph plate speed, 98.5 mph FFE
- Inning 7 – 96.7 mph at 10ft, 94.9 mph plate speed, 103.9 mph FFE
- Inning 8 – 94.1 mph at 10ft, 92.3 mph plate speed, 101.3 mph FFE
1960 Speed Test – High Speed Cameras15
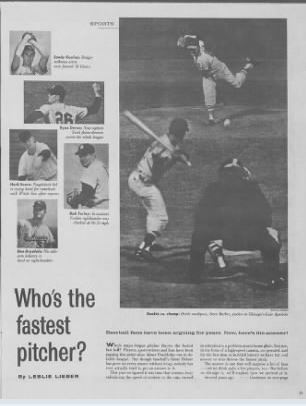
Who's The Fastest Pitcher?
50 frames per second is sufficient to get a good speed reading (even today). You could have as much as 3-4 mph error on a single reading, but 5 readings should reduce the error significantly.Here's how we did the testing: We set up a high-speed movie camera which takes 50 frames a second. It photographed the ball from the pitcher�s mound until it crossed home plate � 60 feet, six inches away. By counting the number of frames it took the ball to reach the plate, our mathematicians were able to translate the velocity into miles per hour. The results were arrived at not on the basis of one pitch � but by averaging the five fastest pitches thrown by each man. The final standings are [below]
Since they were 60.5 feet away, and the speed had essentially been averaged – add 4.5 mph (50% of 9 mph speed reduction to the plate) to get to the 50ft FFE:
- Steve Barber (Orioles rookie) 95.55 mph, or 100.05 mph FFE
- Don Drysdale (Dodgers) 95.31 mph, or 99.81 mph FFE
- Sandy Koufax (Dodgers) 93.20 mph, or 97.70 mph FFE
- Ryne Duren (Yankees) 91.16 mph, or 95.66 mph FFE
- Herb Score (White Sox) 91.08 mph, or 95.58 mph FFE
- Bob Turley (Yankees) 90.75 mph, or 95.25 mph FFE
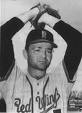
1958 Speed test – Steve Dalkowski – 11th Fastest (tied) – 102.5 mph FFE
5'11" 170 lbs.
(Assuming he was pitching from 60.5 feet away) this pitch was equivalent to a speed measurement taken at the plate. So we should add the 9 mph average speed reduction from the 50ft mark to the plate to get today's equivalent speed, his speed would range from 101.5 to 104.5 and was likely 102.5 mph.
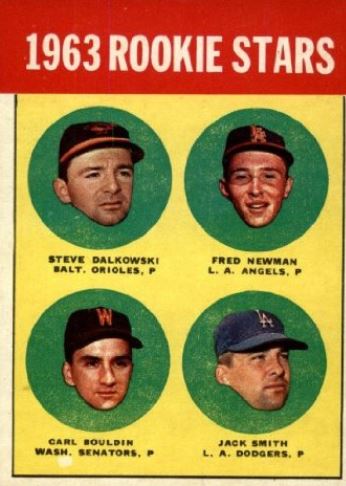
1963 Rookie Card
In Spring Training 1963, Dalkowski was set to finally enter the Big Leagues, when he fielded a Jim Bouton bunt on a fastball, and his arm 'went dead'.
More on White Lightning Dalkowski:
- "The Wildest Pitcher", Time Magazine, 7/18/1960
- The Wildest Fastball Ever 10/12/1970 Sports Illustrated by Pat Jordan
- Jeff Hause, "Steve "White Lightning" Dalkowski, Sports Hollywood, 8/31/2001
- Peter Handrinos Interview with Dalkowski, 10/3/2005
1954 Speed Test – Baltimore – Dumont Oscillographs14
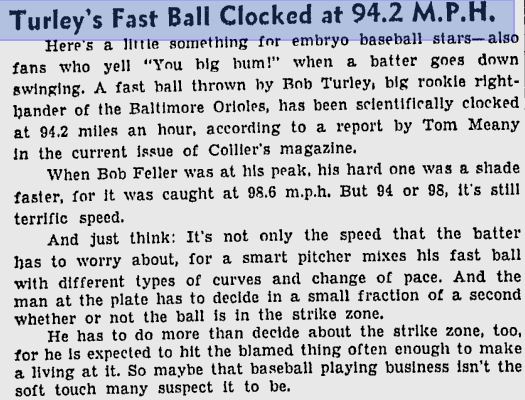
Milwaukee Sentinal 6/12/1954
So "Bullet" Bob Turley (Career: 101-85, 3.64 ERA, 1265 SO, 1958 ML Cy, 3xAllStar, Yankees/Orioles) was tested in Baltimore Stadium on 5/12/1954. Collier's described it this way:
"A Du Mont cathode-ray oscillograph test, arranged recently by Collier's, proved that Turley throws a ball from the mound through two light screens six inches apart in .00362 seconds." "photo-electric eye, all passed through triangular opening, breaking beams from two photoelectric circuits set six inches apart."They described the result as 94.2 mph (it was rounded up from 94.17 mph).
Note that "Bullet" Bob earned his nickname before the 'bullet' test in 1954, likely late 1953 after he returned a 'war hero' to the Browns/Orioles in Aug 1953.
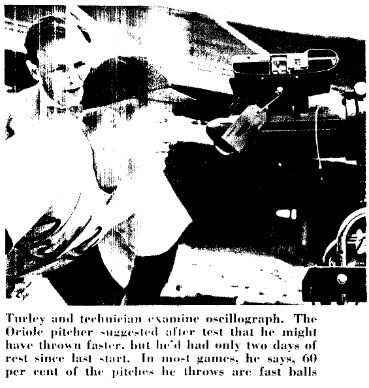
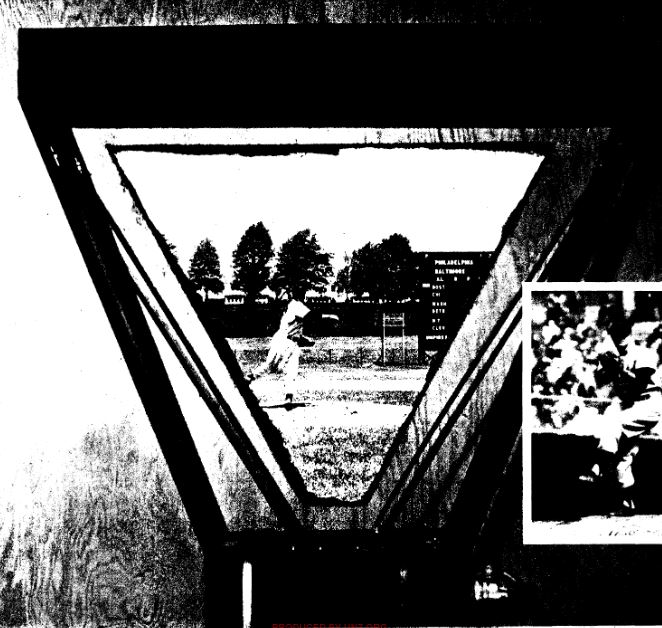
triangular opening
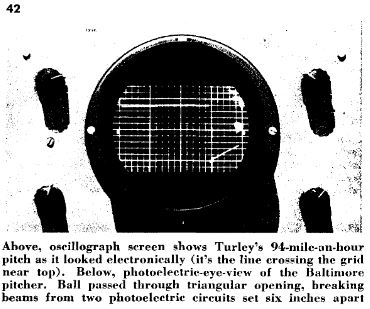
oscillograph
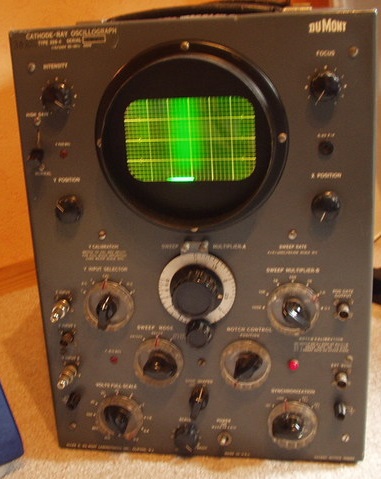
Since he was 60.5 feet away from the device, you must add 9 mph to get to the 50ft FFE
- Bob Turley (Orioles) .00362/6in, 138.12fps/94.17 mph, from 60.5 ft = 103.2 mph FFE
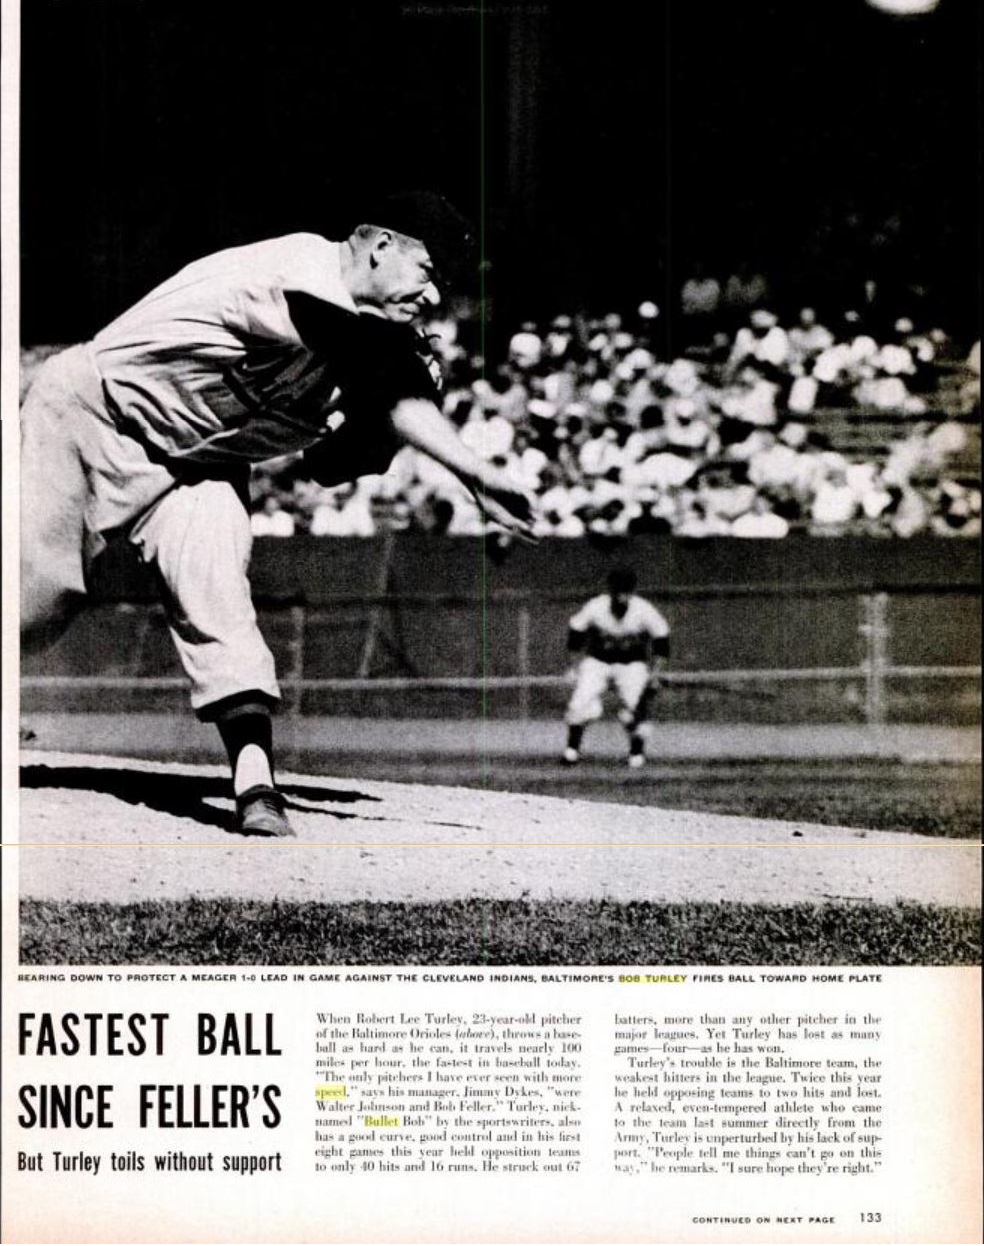
LIFE mag 6/7/1954
- His blazing speed in the May 30, 1954 Sports Illustrated
- He made the cover of Sports Illustrated 5/4/1959 after he won game 7 of the 1958 World Series for the Yankees
- The article The aching, aching arms – here
There is some incorrect information about this test floating around as below – Look was not involved, that I know of, and the device did not come from the Army's Aberdeen facility.:
Look magazine wanted to time his fastball for a story. They borrowed a bullet timer from Aberdeen Proving Grounds and set it on home plate. Turley fired his fastball through the bullet timer at just over 98.
1953 Speed Test – Brooklyn Ebbets Field cathode-ray oscillographs17
Two 'Screens' (L), Oscillograph (R)
DuMont Laboratories, Inc. using their "cathode-ray oscillograph" (basically a stopwatch), plus two v-shaped photoelectric 'screens' to start and stop it, tested the pitching speed of at least three Brooklyn Dodger pitchers. They pitched from the mound through the device at home plate.
9/21/1953
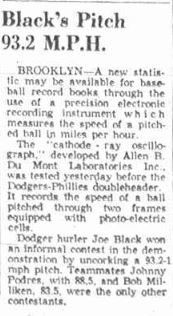
9/22/1953
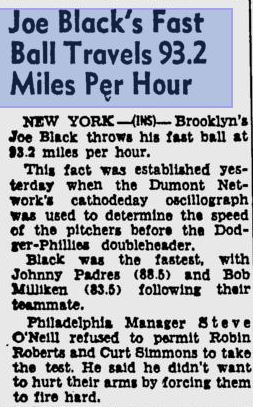
Jan 54
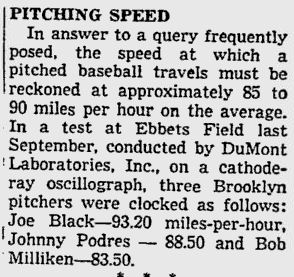
Since they were 60.5 feet away from the device, you must add 9 mph to get to the 50ft FFE:
- Joe Black (Brooklyn reliever) 93.2 mph, or 102.2 mph FFE
- Johnny Podres (Brooklyn) 88.5 mph, or 97.5 mph FFE
- Bob Milliken (Brooklyn) 83.5 mph, or 92.5 mph FFE
- Billy Loes ??
- Ben Wade ??
Meet The Forgotten Joe Black s17
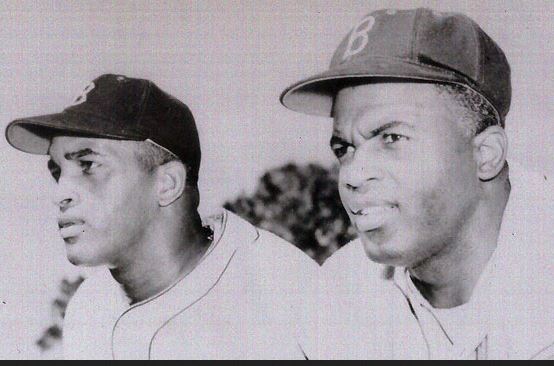
with roommate Jackie Robinson
There's the recent book Meet the Real Joe Black: An Inspiring Life Baseball, Teaching, Business, Giving written by Steven Michael Selzer, who was a student of Joe Black's when he taught at Hubbard Junior High School after his Major League baseball career ended.
Baseball Almanac stats page
Joe Black, as a rookie, started the 1952 World Series for the Brooklyn Dodgers in Game 1 , Game 4 , and Game 7, giving up only 2, 1, and 3 runs, respectively.
You can listen to Joe Black talking about the 1952 World Series
Joe Black's 102.2 mph pitch ranked him, at the time, as the 2nd faster pitcher of all time behind Bob Feller (98.6 mph plate speed in 1946), yet his record of 93.2 mph (at the plate) was never mentioned on any list of fastest pitches that I can find.
Of course, Atley Donald's 1939 speed of 94.77 mph (from 20 feet away) would have also been considered faster than Black's at the time.
Bob Turley (94.2 mph plate speed) would top his speed in 1954. Steve Dalkowski (93.5 mph plate speed) would also top his speed in 1958.
1946 Speed Test – Feller chronograph
See Feller bio section1940 Speed Test – Feller motorcycle
See Feller bio section1939 Speed Tests in Cleveland
showing pitching tests in Cleveland
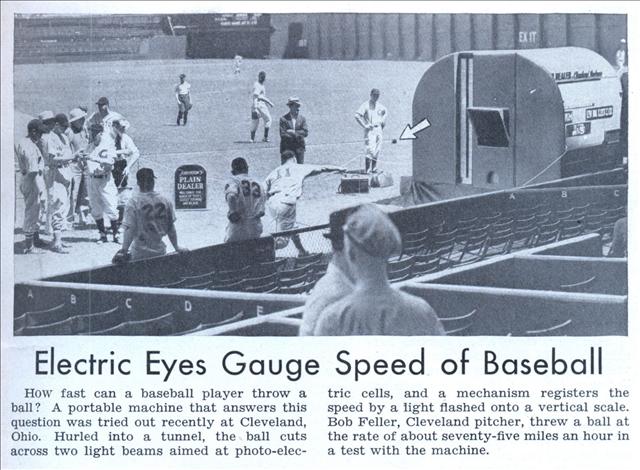
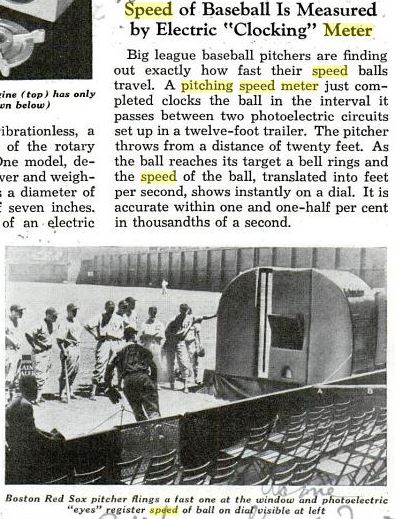
#11 was likely Ben Chapman who was not a pitcher (however he pitched in 1945/46). There was no #33 on the roster, so that must be one of the coaches. Manager Ossie Vitt was #26.
Per the Richmond (VA) Times Dispatch, June 6, 1939 AP article "Meter to Record Feller's Speed" s12:
John A. Crawford of the Cleveland Plain Dealer thought the idea would be useful in selection of pitching and other talents.

President Alvin Bradley of the Cleveland Indians agreed and Rex D. McDill, Cleveland electronics engineer, built the machine.

The new meter, which gives an immediate reading which engineers said compared with standard laboratory meter accuracy, is built in a trailer. You throw into a hole two feet square. Just inside is a set of photo-electric tubes, and five feet back is another set. The device measures the ball's speed between the two points and flashes it on a scale facing the pitcher.
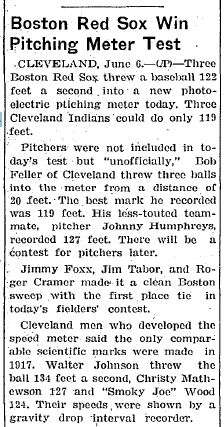
Three Boston Red Sox threw a baseball 122 feet a second into a new photo-electric pitching meter yesterday. Three Cleveland Indians could do only 119 feet.

Pitchers were not included in yesterday's test but "unofficially," Bob Feller of Cleveland threw three balls into the meter from a distance of 20 feet.
 The best mark he recorded was 119 feet. His less-touted teammate, pitcher Johnny Humphreys, recorded 127 feet. There will be a contest for pitchers later.

Jimmy Foxx, Jim Tabor, and Roger Cramer made it a clean Boston sweep with a first-place tie in yesterday's fielders contest.

The best the Indians could do was a tie at 119 feet by Ben Chapman, Julius Solters and Jim Shilling.
Assuming they were 20 feet away – add 4 mph (20/50*9mph) to get to the 50ft FFEs12:
- Johnny Humphries of Cleveland, 127 fps (86.6 mph) at 20 ft away, or 90.6 mph FFE
- Jimmy Foxx of Boston, 122 fps (83.2 mph) at 20 ft away, or 87.2 mph FFE
- Jim Tabor of Boston, 122 fps (83.2 mph) at 20 ft away, or 87.2 mph FFE
- Roger Cramer of Boston, 122 fps (83.2 mph) at 20 ft away, or 87.2 mph FFE
- Bob Feller of Cleveland, 119 fps (81.1 mph) at 20 ft away, or 85.1 mph FFE
- Ben Chapman of Cleveland, 119 fps (81.1 mph) at 20 ft away, or 85.1 mph FFE
- Julius Solters of Cleveland, 119 fps (81.1 mph) at 20 ft away, or 85.1 mph FFE
- Jim Shilling of Cleveland, 119 fps (81.1 mph) at 20 ft away, or 85.1 mph FFE
Thousands of major and minor league players, and some 'sandlotters', (reportedly 27,000 in all!) were tested with this machine afterwards during the summer of 1939.s9
First was Dee Miles, an outfielder for the Philadelphia Athletics, who became the record holder for a while at 136 fps/ 92.7 mph, or 96.7 mph FFE.
Then, on August 30, 1939 Atley Donald, the Yankees' sensational rookie who went 13-3 that year, was tested in Cleveland and became the worlds' fastest throwing 139 fps/ 94.77 mph (or 99.3 mph FFE)
Presumably between then and Nov 25, 1939 Rudy York [infielder], Ralph [Red] Kress [infielder] and Roy Cullenbine [outfielder] of the Detroit Tigers also threw 139 fps to tie Atley Donald's record.
Steve "Sandy" Sundra (Yankees pitcher) and Wally Moses (Philadelphia Athletics LH outfielder) tied for 2nd throwing 131 fps/ 89.3 mph, or 93.3 mph FFE.
To summarize and rank these later tested later from June 7 through the end of the 1939 season:
Assuming they were 20 feet away – add 4 mph (20/50*9mph) to get to the 50ft FFE:
- Atley Donald (Yankees) 139 fps/ 94.77 mph, or 99.3 mph FFE
- Rudy York (Tigers) 139 fps/ 94.77 mph, or 99.3 mph FFE
- Ralph Kress (Tigers) 139 fps/ 94.77 mph, or 99.3 mph FFE
- Roy Cullenbine (Tigers) 139 fps/ 94.77 mph, or 99.3 mph FFE
- Dee Miles (Athletics) 136 fps/ 92.7 mph, or 96.7 mph FFE
- Steve Sundra (Yankees) 131 fps/ 89.3 mph, or 93.3 mph FFE
- Wally Moses (Athletics) 131 fps/ 89.3 mph, or 93.3 mph FFE
It's interesting to note that 4 unidentified 'sandlotters' also tied for 2nd at 131 fps.
1933 Speed Test at West Points19
In June 1933, the Dodger's Van Lingle Mungo and the Yankee's Lefty Gomez, two of the fastest pitchers of the time, went to West Point's ballistics lab. We don't know how far the device was from the pitchers.We will assume 60 ft for this purpose, so add 9 mph to get to 50 FFE.
- Van Mungo (Dodgers), 113 fps (77.0 mph) at 60 ft plate, or 86 mph FFE
- Lefty Gomez (Yankees), 111 fps (75.7 mph) at 60 ft plate, or 84.7 mph FFE
1930 Speed Test at West Point s16
Mark Koenig (Yankees shortstop) and Lou McEvoy (Yankees pitcher) went to West Point Military Academy on 5/23/1930 to be tested by Capt HA Hinsley and some cadets. Lou McEvoy was measured at 150 fps. Koenig was measured and 'almost equalled' McEvoy but it was not reported. Later reports have falsely attributed the 150 fps reading to Koenig.We have no details on how the test was performed, so we can't determine if/how to adjust to FFE.
- Lou McEvoy (Yankee pitcher) 150 fps/ 102.27 mph.
- Mark Koenig (Yankee shortstop) ??
1917 Speed Test– Remington, Bridgeport, CTs29
The earliest 'evidence' of this test appears in 1939 articles during the Cleveland speed tests, based on 20 year old recollections. Mathewson stopped pitching in 1916, when he only pitched 4 games. Joe Wood was operated on for appendicitis preseason 1914, and displayed visible shoulder pain in October 1915, and his speed dropped visibly. He would not accept a cut in pay, so he rehabbed at home during 1916. In Feb 1917, he was sold to Cleveland where his debut May 25th was a disaster. He became an outfielder after that.
AP reported in 1939
Sponsors recalled that back in 1917, in Bridgeport (Conn.) arms laboratory [likely Remington Arms], Walter Johnson recorded 134 feet per second, Christy Mathewson 127 and "Smoky Joe" Wood 124. They used a gravity drop interval recorder."
Assuming they were 20 feet away – add 4 mph (20/50*9mph) to get to the 50ft FFE:
- Walter Johnson, 134 fps (91.4 mph) at 20 ft away, or 95.4 mph FFE
- Christy Mathewson, 127 fps (86.6 mph) at 20 ft away, or 90.6 mph FFE
- Smokey Joe Wood, 124 fps (84.5 mph) at 20 ft away, or 88.5 mph FFE
1913 Speed Test – NY Giants – Gilbreth Hand-cranked Cameras18
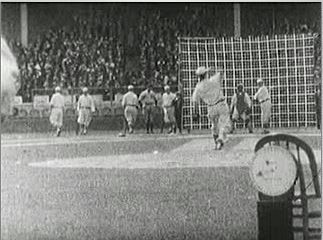
watch 1913 footage Archive.org
George H. Daley, sports editor of the New York Tribune read this and organized a similar study of the New York Giants team.
On May 31, 1913 �in the presence of some 20,000 fans, and the �tearing� music of a 70 member Cuban marine band whose battleship was docked offshore� Gilbreth recorded the Giants� pitching and batting speeds and motions, as well as the time needed to steal second base.
Time and motion measurements were reported in the New York Tribune newspaper, among others that picked up the story (for example: Sporting Life, 1913)".
You can watch the film of the parts of the study at Archive.org where the Giants are about to play the Phillies at the Polo Grounds.
Gilbreth used a 16mm video camera, and since it was cranked by hand, produced a variable frame rate. This is the reason black and white 'talkie' films look 'jerky'. So he devised a special clock, which appears in every frame, that makes one revolution per second (based on looking at the video), and is divided into what looks like 40 sections – 4 groups of 10. (Note that he used different clocks with various speeds for other experiments). The custom clock enabled him to determine the 'length' of time between each frame with tremendous accuracy.
White (minors?) was hitting, Mullaney (minors?) was catching, Fred Snodgrass was at 2B. Art Fromme was the pitcher. He surmised that the best speed/time for Fromme from release to the catcher's mitt was 0.351 seconds. Fromme was on the mound 60.5 feet away, and the catcher appears to be standing about 5 feet behind home plate, but his glove is about 3 feet closer.
Apparently several pitchers were tested, but not reported anywhere.
The average speed made by the Giants pitchers was .403172, approximately two-fifths of a second, or at the rate of 170.075 feet a second, while that of the Brown pitchers was approximately .5 of a second, or a tenth of a second slower.So, Fromme's time was tested at .351 seconds. The reported speed is 185.185 fps – which converts to 126.26 mph.
Let's examine the many problems with the calculation:
The distance – 65 vs. 56.5 feet
65 feet distance – 185.185 fps is obviously based on 65 feet distance over .351 seconds. However, the pitcher's stride is probably 6 feet, and the catcher's mitt was only 2 feet behind the plate. So, the real distance for the calculation is 56.5 feet (60.5-6+2). So, the real fps using 56.5 feet at .351 seconds is 160.97 fps (56.5/.351) – or 102.93 mph – or 107.43 mph FFE (+4.5 mph since frame rates are average speeds).
The low frame count
The basic problem with Gilbreth's method is the limitations of a low frame rate camera. Based on my review of the 4 pitching clips in the film, his frame rate ranged from 22 to 35 fps. The margin of error between each frame when looking at pitch speeds, when using low frame rates like this, is 6-9 mph between each frame. Based on my experience reviewing hitting and pitching clips, even a 30 fps camera is not very good for this purpose. A 50/60+ fps camera is much, much better to determine pitch speeds.
Camera Blur (rolling shutter) and low film quality
Sometimes the clock appears to have two second/minor hands instead of one because of camera blur (rolling stutter).
It's hard to tell which frame starts, and which frame ends the process. You can't determine if the catcher has the ball or if it's still in the air. You can't tell if the pitcher still has the ball or if he has released it.
Misjudging the starting or ending frame by a single frame can introduce an extra 6-9 mph error possibility.
Fresh Review of the Pitching 1913 Clips for Art Fromme
I reviewed the four pitching clips. Here is what I saw – assume 56.5 feet (60.5-6+2) + frame counts result in average speed – so add 4.5 mph (50% of 9 mph):
- 100.8 mph, avg speed 96.3 (14 frames, 0.400 secs, 141 fps) + 4.5 ffe – (9:29 mark – 28/40 to 44/40)
- 90.1 mph, avg speed 85.6 (10 frames, 0.450 secs, 125 fps) + 4.5 ffe – (9:32 mark – 31/40 to 49/40 camera blur)
- 100.8 mph, avg speed 96.3 (11 frames, 0.400 secs, 141 fps) + 4.5 ffe – (9:35 mark – 30/40 to 46/40 clear)
- 95.1 mph, avg speed 90.6 (10 frames, 0.425 secs, 133 fps) + 4.5 ffe – (9:39 mark – 26/40 to 43/40)
So, Fromme's speed could have been 100.8 mph – plus or minus up to 6-9 mph. I'm giving him a 98-102 mph range.
Also, according to the 1915 Spalding Base Ball Guide, there is a reference to an additional time study of some sort performed on a team(s) in June 1906.
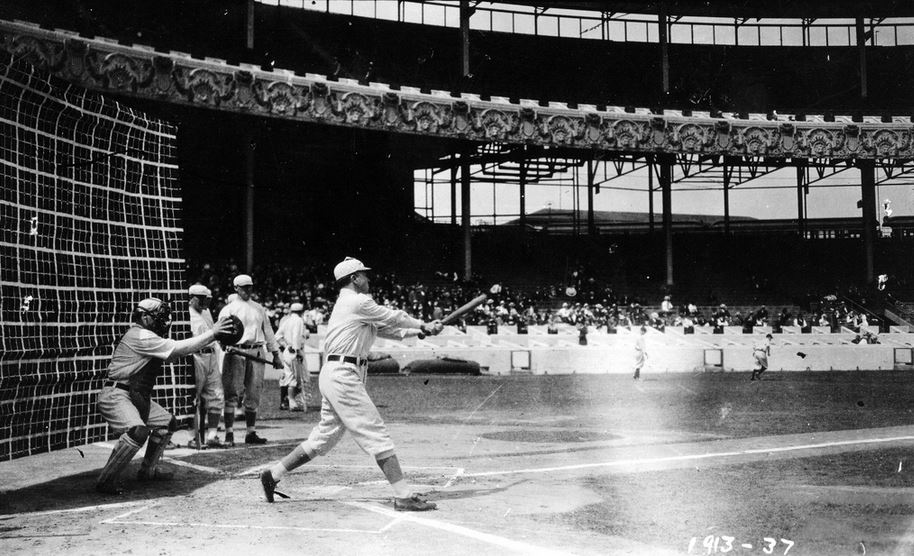
White (R) and Mullaney
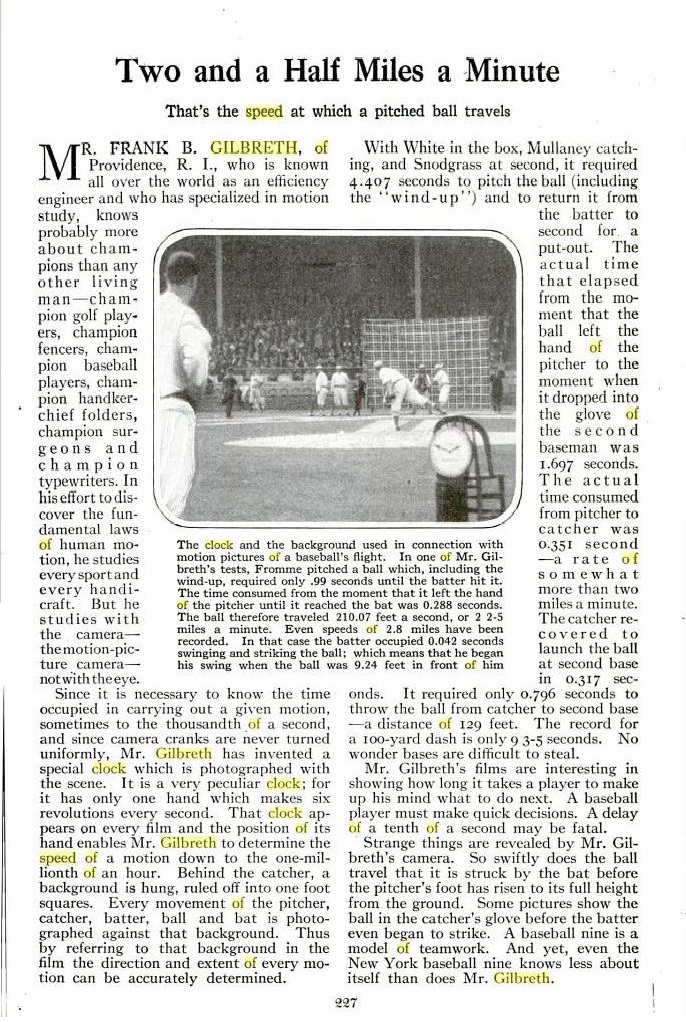
Aug 1917
1912 – Remington, Bridgeport, CT – World's First Pitching Speed Test by Baseball Magazine s6
Dec 1912 Cover
Warning – Some of this 1912 information is wrong – working on it today 10/10/2014
According to the book 'Walter Johnson, Baseball's Big Train's6, the device was a tunnel of fine wires with a 2ftx2ft opening ending at a steel plate. The ball would trip the wires and register the time and then measure the arrival time at the steel plate. The device was about 60 feet away and was shoulder height, so Johnson had a hard time getting his sidearm pitches through. So, the speed was actually measured at 75 feet. Johnson's best was 122 fps, Rucker's at 113, both on their 3rd and final tries.However there is contradictory info in the Sporting Life 11/16/1912 article, Walter Johnson's Speed Excels That of All Pitcherss6, the device had a round opening with some charged electric wires, and 5 feet behind that was a charged steel plate (not sure if the housing for this device is 5 feet or 15 feet?). The pitchers stood 25 feet away. Results were 125 fps for Johnson and 115 fps for Rucker. Johnson took 4 attempts, Rucker hit it on the first try.
And further contradictory info in 10/25/1912 The Hardware Reporter article, First Test of Speed of Pitched Ball in World's Historys6:
The frame was three feet square (no mention of the opening size/shape), each pitcher threw 3 times and the best time was their last with Johnson at 122 fps and Rucker at 113 fps.
Device 5ft vs. 15 ft – there were some contradictory reports over the length of the device itself – some say 5 yards, some 5 feet, and one says 15 feet.
122 fps vs. 125 fps – since the Dec 1912 Baseball Magazine article is actually titled 'One Hundred and Twenty-two Feet a Second', and the editor F.C. Lane actually attended the test, plus the Hardware Reporter article listed the 3 test pitches for each pitcher 120,121, then 122 fps for Johnson and 106, 109, then 113 fps for Rucker, I am going to assume that 122 fps is the reliable speed number (vs. 125 fps mentioned in the 1912 Sporting Life).
Assuming 15 foot tunnel story (least likely to me)
Assuming they were 60.5 feet away from the opening, plus half of the 15ft tunnel averaged at 7.5 ft – add 12.2 mph (68/50*9mph) to get to the 50ft FFE – and add, not deduct 1.4 mph (7.5/50*9mph) to get plate speed:
- Walter Johnson, 122 fps (83.2 mph), or 84.6 mph plate speed, or 95.4 mph FFE
- Nap Rucker, 113 fps (77.0 mph), or 78.4 mph plate speed, or 89.2 mph FFE
Assuming 25 feet away story
Assuming they were 25 feet away – add 4.5 mph (25/50*9mph) to get to 50ft FFE, and deduct 4.5 mph (25/50*9mph) to get to plate speed:
- Walter Johnson, 122 fps (83.2 mph) at 25 ft, or 78.7 mph plate speed, or 87.7 mph FFE
- Nap Rucker, 113 fps (77.0 mph) at 25 ft plate, or 72.5 mph plate speed, or 81.5 mph FFE
with same article
Ballistic engineers had skillfully adapted the chronograph, an instrument employed in accurately testing Remington-UMC [Union Metallic Cartridge] ammunition, to measure in seconds the flight of a baseball, and at the suggestion of F.C. Lane, editor of the Baseball Magazine, the rather elaborate test had been arranged.

When the speed of the rifle bullet is to be determined on the chronograph, the arm is placed in a fixed position at a known distance from a large 5-16th-inch steel plate at the end of an enclosed range, something like an elongated shooting gallery of the common type.

Over the muzzle of the gun a thin copper wire is stretched.  The speeding bullet cuts the wire and electrically releases an upright rod on the recording instrument at the rear of the weapon.  The impact of the bullet on the steel plate, in the same manner, releases a knife which nicks the bar as it falls past a given point and from the distance recorded on the bar, the length of time required for the missile to travel from wire to plate is computed in feet per second.

One of the changes necessary to meet the requirements of the 'pitching arm' was to arrange a network of copper wires over a frame about three feet square, through which the ball was thrown.  This frame was mounted on an upright standard and was raised or lowered to correspond with the heights of the pitchers or the styles of ball to be delivered.
Controversy over the date of the speed tests6
A national article from October 1912 said that Johnson and Rucker left on Saturday the morning before their last regular season game on Oct 5, 1912 (not the next day) and made the 55 mile round trip to Bridgeport in 2 hours, traveling in a big Franklin car with the Baseball Magazine editor, some NY World writers and AP Lane, a champion pistol shooter.Press
probably not an accurate depiction of the device
Walter Johnson, Wonderful Hurler, Who Can Snap the Ball 122 Feet a Second�Prevents the Mightiest Batsmen of the American League From Making a Run for 56 Consecutive Innings�Throws a Baseball Faster than the best Speed of the Twentieth Century Limited. SO sang a minor poet of the major leagues. The hero of this baseball epic was Walter Johnson, the marvellous pitcher of the Washington Club, who has just beaten all records by hurling the ball for fifty-six consecutive innings with such skill and cunning that not a batsman of an opposing club has been able to score a run. Speed, was the great factor in the achievement� dazzling, sizzling speed! The big Idahoan's delivery is like the flight if a shell. The mightiest hitters of the American League are as helpless as town lot players when Johnson turns loose his fastest ball; "Tv" Cobb, "Home Run" Baker and Jackson alike are babes in his hands. Johnson's amazing swiftness in pitching is no mere fancy. It has been scientifically measured. In the testing room of the Remington Arms Company at Bridgeport. Conn., Johnson showed that his right arm could hurl the baseball at the rate of 122 feet a second! It was acknowledged that he could do even better, because in athletic parlance he was not warmed up. It is well known that a hurler gathers speed as a game progresses. Johnson hung the sphere through an aperture in a frame of wood about two feet square. Running from top to bottom there were ten very delicate and filmy? copper wires. These were broken by the ball, and by an electrical device the moment of passage was accurately timed. Five yards away was a steel plate and the impact of the ball on this barrier again caused the electric clock to register. Thus the exact time of the ball's flight was mathematically determined. The velocity obtained by Johnson is all the more extraordinary when it is known that a bullet from the new Government .45 automatic pistol travels 800 feet per second. A high power hunting rifle, .35 calibre, auto-loading, travels 2,000 feet per second. 'The Twentieth' Century Limited, the fastest long-distance train in the world, makes the 978.7 miles from New York to Chicago in just twenty hours, or an average speed of 48.9 miles every hour. This means a velocity of nearly seventy-two feet a second. Suppose Johnson's speedball kept on travelling at 122 feet a second right on toward the Windy City at its own hurricane speed. It would eat up the 5,163,840 feet to Chicago in Just 11 hours, and 48 minutes. The ball would beat the train to Chicago by 8 hours and 12 minutes. In other words, the catcher who received the ball could go to bed, have a full night's rest, get up and into his uniform again, and be on hand in the morning to meet the Twentieth Century as she rolled into Chicago. Putting it another way�the train leaves New York at 2.45 P. M. daily. Time is set back at Buffalo by just an hour, so that the onrushing train gains sixty minutes on her Westward journey. Eleven hours and forty-eight minutes after the start Johnson's bender has reached Chicago, or at 1.33 A. M. Chicago time, the roaring locomotive has just plunged through Cleveland with stopping, more than 350 miles away. The striking energy of Johnson's missile was shown to be 160 foot pounds. That means that it possessed approximately half the force in impact of a bullet fired ; from a .45 automatic pistol! According to these figures, it takes less than half a second for a ball thrown by Johnson at his high speed to travel from his fingers to catcher's glove! That is why he bewilders even the quickest witted batsman. He isn't able to guess whether it is a straight ball, or an in or an out curve, a drop, or whether the sphere is going to jump up into the air in defiance of the law lof gravity. "Any time you get a hit off Johnson," declared Napoleon Lajoje, himself one of the most formidable wielders of the bat that the game ever knew, "you must not think that you're smart. Just figure that you're lucky �lucky that you were able to make that blind swing at just the right spot. There never was, and I doubt if there if ever will be, a pitcher as great as Johnson. If he turned loose his very hardest throw with his best curve on it no catcher could get down in time to receive the ball. "Every ball he throws has stuff on it that can't be solved. Some of the hops that his swiftest ones take are bigger curves than a man ever threw before. I've seen him slam balls up to the plate that didn't look larger than a pinhead." Not surprising, is it, that Johnson is such a terror? The quiet, modest young Idaho youth -he is only twenty-five years old – also fooled his opponents into giving him another record. Last year he struck out 303 men in 386 innings. None of the other wizards could touch that mark. Before he became a big leaguer striking out batsmen was merely a pastime for him. Out in Weiser, when only nineteen, he was playing in the Idaho State League, and among the performances credited to him was the striking out of the first eight men who faced him in an important game, and he later struck out eleven other men during the nine innings.
Why Isn't Sidd Finch's 168 mph On This List? What about Goose Gossage at 103 mph?
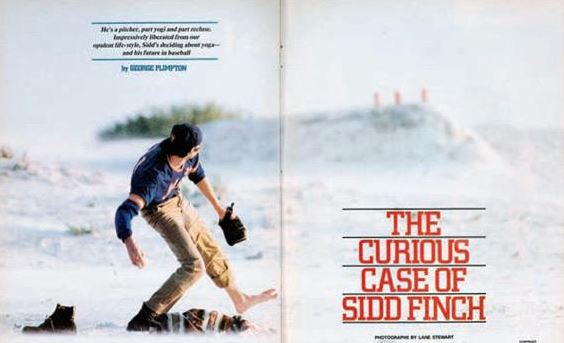
Well, it turns out the article was an elaborate April Fools Joke... a hoax. The Mets organization was in on it.
It created such an uproar, that Sports Illustrated had to issue a Letter From the Publisher two weeks later to clear it all up and confirm that it was all a hoax.
In 2013, Sports Illustrated themselves fell for the hoax. We noticed in the 3/8/2013 SI article that Goose Gossage threw 103 mph. The source link is George Plimpton's April Fools 1985 hoax article above. Considering the nature of the Plimpton article, we have our doubts about 103 mph for the Goose.
The Sidd Finch article says "The highest number that the JUGS had ever turned for a baseball was 103 mph, which it did, curiously, twice on one day, July 11, at the 1978 All-Star game when both Goose Gossage and Nolan Ryan threw the ball at that speed."
ahem...Nolan Ryan isn't listed on the roster or the reserve list for the 1978 All Star Game.
The hoax is still alive.
Good Articles Related to Fastest Speeds u8
- 4/4/2011 Tom Verducci's article in Sports Illustrated Radar Love
- 2006 fastest speeds per Damon Lichtenwalner, Baseball Info Solutions, and quantity of 100+ pitches per The Bill James Handbook 2007 (2006 stats) as referenced
- Guinness World Record Pitcher
- Speed Trap for an Angel Sports Illustrated article on Nolan Ryan's record setting pitches
- The Bringer Of The Big Heat -To say Nolan (Four No-Hitter) Ryan is fast is an understatement. Even his curve has been clocked at 85 mph 6/16/1975 Sports Illustrated article by Ron Fimrite
- A GREAT HAND WITH THE OLD COWHIDE The man in the saddle, cattle rancher Nolan Ryan of Alvin, Texas, still burns his brand on baseball after 20 years and 4,259 strikeouts 9/29/1986 Sports Illustrated article by Ron Fimrite
- Remembering Ryan and info on the laser machine
- Dr. Alan Nathan's Guide to Pitch F/X – by Mike Fast
- Baseball Almanac Fastest Pitchers has image of stadium readings
- 15 Fastest Pitchers Ever Recorded in Bleacher Report 4/20/2011
- RAPID ROBERT Can Still Bring It by Frank Deford 8/8/2005
Sources and Updates
Sources for Radar Era – 1975 on
- (r1) A John Dewan article,
What are they feeding Zumaya dated October 26, 2006
in Bill James Online lists the qty of pitches per year 2002-2006, in addition to the leader and his qty each year
MLB 2002 	106 	Billy Wagner – 42
MLB 2003 	204 	Billy Wagner – 159
MLB 2004 	82 	Kyle Farnsworth – 30
MLB 2005 	134 	Daniel Cabrera – 37
MLB 2006 	335 	Joel Zumaya – 233
- (r2) qty 100+ for 2004 per
Michael O's The Metropolitans blog recapped Bill James Book 2005 (2004 stats)
Kyle Farnsworth led the Majors and threw more pitches over 100 MPH than all other pitchers combined in 2004 in the AL. He threw thirty, Wagner threw eight, Burnett threw four, and Edwin Jackson threw two to round out the NL leaders.
- (r3) Taken from stadium radar gun during a game per baseball-almanac.com
- (r4) Baseball Almanac has image of stadium readings
- (r5) TheSmartMarks forum on 12/24/2004 indicated that Jesus Colome had 8 pitches 100+ in 2004.
Kyle Farnsworth threw 30 pitches over 100 mph. The next highest pitchers (Billy Wagner and Jesus Colome) had eight. Rich Harden threw the most pitches over 95 mph (746).
- (r6) A Baseball Analysts 12/10/2003 article The Handiest Reference Book of 'Em All by Rich Lederer said
Billy Wagner led the major leagues with 159 pitches thrown at 100+ mph. The next highest was Colon with 12. Kyle Farnsworth (8), Jorge Julio (4), Josh Beckett (3), Jesus Colome (3), Francisco Cordero (2), Tom Gordon (2), and Braden Looper (2) were the only other pitchers in the majors to throw more than one pitch at 100 mph. Wagner also placed third in the majors in the number of pitches thrown at 95+ mph, a remarkable achievement for a reliever. Wood was number one in the latter category with 1,138.
- (r7) A John Dewan article,
Who threw the most 100+ MPH pitches? dated January 5, 2006
Daniel Cabrera, Baltimore 	37
Billy Wagner, Philadelphia 	18
A.J. Burnett, Florida 	17
Kyle Farnsworth, Detroit-Atlanta. 	15 (He was the 2004 leader with 30)
Seth McClung, Tampa Bay 	11
Bobby Jenks, Chicago White Sox 	10
- (r8) 2006 fastest speeds per Damon Lichtenwalner, Baseball Info Solutions as noted in Jerry Crasnick's ESPN article on 3/26/2007 High Speed Pursuit
- (r9) 2006 quantity of 100+ pitches per The Bill James Handbook 2007 (2006 stats) as referenced in Jerry Crasnick's ESPN article on 3/26/2007 High Speed Pursuit
- (r11) Mark Lowe 102 mph on 8/2/2006 per SeattleSt.com 'Lowe struck out Ramon Hernandez on a pitch that the Camden Yards radar gun recorded at 102 mph', a news article by Larry Larue with the Tacoma News-Tribune 'Holding a one-run lead in the eighth inning Wednesday, rookie Mark Lowe threw a fastball the Camden Yards radar gun clocked at 102 miles per hour', and another blogger a commenter at 2:22pm noted 'According to the radar gun mark lowe just threw 102'
- (r13) Jayson Stark ESPN 6/14/2010 article Three Strikes: Amazing weekend
says:
with the help of ESPN stats guru Katie Sharp, and our friends from Inside Edge and pitch f/x, we compiled a list of every home run we could track down against a pitch measured in triple digits.

June 13, 2010: Travis Hafner off Stephen Strasburg, 100 mph
Aug. 1, 2009: Jonny Gomes off Ubaldo Jimenez, 100 mph
April 10, 2007: Corey Patterson off Joel Zumaya, 100 mph
Aug. 19, 2005: Chris Shelton off Brandon League, 101 mph
June 18, 2003: Luis Gonzalez off Billy Wagner, 100 mph
May 9, 2002: Mike Sweeney off Bartolo Colon, 100 mph
- (r14) Wagner 2004 – Billy Wagner threw 101 on 4/16/2004 per
Sam Carchidi Philly Inquirer 4/17/2004 article
A win, according to plan Phils take 2d straight behind power and pitching
Wagner had the 39,613 fans standing and waving white rally towels during his overpowering ninth inning, one in which he struck out two, one on a 101 m.p.h. fastball. Four of Wagner's nine pitches reached at least 100 m.p.h. on the scoreboard.
and Don Bostrom with The Morning Call 4/17/2004 article The Phillies' Big Three deliversThe Phillies don't figure to lose many games this year in which sluggers Pat Burrell and Jim Thome both go deep and elite closer Billy Wagner is rushing it up there at 101 mph.
- (r15) Verlander 2006 – ESPN game recap
Tigers win fifth straight with sweep of slumping Mariners
Justin Verlander came out throwing 100 mph and higher in the first inning. When he settled down into the upper 90s, the Mariners didn't have a chance. Verlander, who hit 100 and 101 mph against Richie Sexson in the first inning and didn't allow a hit until Yuniesky Betancourt's two-out single in the fifth.
- (r16) Wagner 1998 – New York Times 8/10/1998 article
NATIONAL LEAGUE: ROUNDUP; McGwire and Sosa Take a Few Walks
ASTROS 11, PHILLIES 2

Billy Wagner pitched for the first time since being hit in the head by a line drive.

Wagner received a standing ovation when he came to the mound for the ninth inning. He struck out Bobby Estalella for the first out, gave up a double to Jon Zuber and hit 100 miles per hour on the radar gun with a pitch to Doug Glanville.
- (r17) Nen 1997 -Robb Nen, Marlins, threw 102 mph in Game 1 of the 1997 World Series 10/18/1997 per Sun Sentinal 10/20/1997
and LA Times. I could not find any references to Nen throwing 102 4 games later in Game 5 10/23/1997 as reported by baseball-almanac.com
I captured the 102 mph stadium reading from a youtube of the Game 1 1997 broadcast (see 21:09-21:43)
An AP story on 10/20/1997 by Steven Wine Gale warning: Nen's heat blows Indians away provided the most detailsRobb Nen really can throw 100 miles per hour. He did it four consecutive times Saturday night during Game � of the World Series. When two pitches registered at 102 mph on the scoreboard radar gun, the crowd of 67,245 gasped in awe. David Justice somehow managed to pull a 102 mph pitch into right field for a single. Then, Matt Williams reached on an infield single. Jim Thome, who hit 40 home runs this season, stepped to the plate hoping to continue the Indians' recent pattern of late-inning heroics. "I was looking for a ball to drive and tie up the ballgame," he said. Instead, he swung and missed at a 102-mph fastball for strike three.
- (r18) Per Tom Verducci, Sports Illustrated, 10/9/1995 (bad link now archived here at
page 1
and page 2
), and
The Baltimore Sun, 9/17/1995 page 2
"Marlins pitching coach Larry Rothschild on Braves closer Mark Wohlers, after watching him consistently hit 103 on the speed gun... Wohlers wasn't under 100 the whole time"
and a 10/7/1995 Philly Enquirer article Wohlers Gets Raves, Saves For Atlanta by Phil Sheridan and Diane Pucin, INQUIRER STAFF WRITERSMark Wohlers' fastball lights up radar guns at speeds up to 103 m.p.h.
- (r19) Jenks 2004 – Per MLB.com writer Doug Miller in a 4/21/2004 article:
Jenks, 23, is one of the hardest-throwing prospects in baseball, with a fastball that regularly reaches 98-100 mph and registered 103 mph on a radar gun in Puerto Rico last winter.
- (r20) Jenks 2005 – 8/27/2005 Jenks 102 mph reading was witnessed by a blogger Jamie in Seattle
- (r21) Josh Beckett 102mph in 2004 – an
Associated Press game recap on 4/18/2004 for the night before said
Chipper Jones and the Atlanta Braves are slowing down the Florida Marlins. Jones homered for the second straight night, and Russ Ortiz outpitched Josh Beckett to lead the Braves over the World Series champions, 4-1, last night in Atlanta.

Beckett (1-1) entered with a 0.64 ERA that soared to 2.21. His fastball was recorded as high as 102 miles per hour and he struck out seven, but he allowed four runs in 6 1/3 innings.
- (r22) Mark Wohlers 101 1995 – Bob Nightengale LA Times 7/6/1995 article
One-Pitch KO Leaves Braves Feeling Chipper : Dodgers: Jones homers on Seanez's first delivery in ninth to give Atlanta 4-1 victory. Nomo strikes out 10, doesn't figure in decision. for a game the night before
He [Lasorda] was annoyed that Brave closer Mark Wohlers threw 101 m.p.h. by one radar gun's estimation in the ninth inning.
- (r23) Justin Verlander radar vs post-season Pitch F/X 2006 – radar per
Tim Sullivan in his 10/12/2006 article SignOnSanDiego
Padres should rue one that got away discussing the playoff game the night before
Verlander reached 103 mph in the third inning last night, and earlier hit 101 while pitching from the stretch position.
- (r24) AJ Burnett 4/13/2005 – AJ Burnett threw 101 mph
- (r25) Matt Lindstrom 5/16/2007 – 5/17/2007 MLB article by Joe Frisaro (game the night before) 'Matt Lindstrom worked through the eighth inning, striking out two while giving up one hit. The hardest thrower on the team, Lindstrom had one fastball clocked at 102 mph on the stadium scoreboard.'
- (r26) Mark Wohlers 1995 World Series – I reviewed film of every pitch Wohlers made in the 1995 World Series. Game 2 10/22/95 8th Thome 98,99 (per game 3 broadcast, this was his high for the game) – 9th Amaro ?,98,98,98,95 – the other speeds were not displayed. Game 3 displayed pitches 8th Vizqel 97,97,? – 9th Belle ?,100,85,84,99 – Murray 99 – 10th Ramirez ?,83,98,99,?. Game 4 displayed pitches 9th Manny Ramirez 97,98,99,?,? home run – P Sorrento ?,?,99,?,?. Game 6 displayed pitches 9th none.
- (r27) A.J. Burnett 5/31/2005 104 mph stadium radar –
CBS game recap for Marlins game on 5/31/2005 said:
One of Burnett's fastballs was clocked at 104 mph on the PNC Park scoreboard.
Jeff Passan with Knight Ridder in The Spokesman-Review on 6/21/2005 Speed Zone said[In] Pittsburgh's PNC Park on May 31 [2005]. Florida starter A.J. Burnett, known for a fastball that occasionally touches triple digits, unleashed a heater that read 104 mph on the scoreboard. The Pirates turned off the gun before you could say 'bogus'.
In a 6/2/2005 blog posting (I can't find the original article), it implies that the 104 reading was not considered credible at the timeAs the Miami Herald reports, "Several scouts confirmed that Marlins pitcher A.J. Burnett did not hit 104 mph with a first-inning fastball Tuesday. The PNC Park scoreboard registered that figure on a pitch Burnett threw to Freddy Sanchez, drawing amused looks from players on both benches. The scoreboard was turned off and recalibrated after that. Scouts said Burnett was consistently hitting in the upper 90s and low 100s."
Another blog posting on 6/6/2005 saysper Ben Maller's Sports Rumors & Notes (link is dead): "Several scouts confirmed that Marlins pitcher A.J. Burnett did not hit 104 mph with a first-inning fastball Tuesday. The PNC Park scoreboard registered that figure on a pitch Burnett threw to Freddy Sanchez, drawing amused looks from players on both benches. The scoreboard was turned off and recalibrated after that. Scouts said Burnett was consistently hitting in the upper 90s and low 100s."
Other Sources – see Radar section above for Radar Era Sources
- (s1) Ryan – As told by Tom Lederer, the pitcher who first tested the laser in Rockwell's parking lot,
at BaseballAnalysts.com.
Note the Angels were scared to call the device by it's correct name, laser radar, and instead called it "infrared radar" in the press.
Guinness Book of World Records page - (s2) Pitch F/X – Per MLB article 10/2/2007, 'Pitch-f/x adds insight to watching games'.
- (s3) Ryan –
Dan Hafner in the 9/2/1974 LA Times said
from the book High Heat by Tim Wendel p113The infrared beam from a low-power transmitter is aimed at a spot 9 or 10 feet in front of home plate.
Per Ron Fimrite's Sports Illustrated article 9/16/1974 after the second test/game, Speed trap for an AngelFour Rockwell International scientists rigged up an infrared radar device from the press box. Fans were invited to guess to the nearest one-tenth of a mile per hour how fast Ryan could throw. Entries were sent care of Ryan Express at the Angels, with the grand prize being a trip for two to the American League Championship Series that season. The event was hyped by CBS Sports, and by the time the day came around – a September 7 game versus the Chicago White Sox – Ryan had had enough hoopla. "I didn't like it," he said afterward. "It takes too much away from your concentration." The infrared device only tracked strikes, and Ryan voiced his concern that "a lot of balls outside the strike zone have more velocity." A pitched ball need to pass through an infrared beam 17 inches wide and 2 inches high to record a reading. ... For the record, Ryan's best clocking by infrared was 100.9 miles per hour. ...Rockwell International acknowledged that Ryan was actually clocked approximately 45 after the ball left his hand, rather than at home plate. The rule of thumb tends to be that a pitched ball loses up to 10 miles per hour by the time it reaches the plate. So, in this case, "that means on a modern gun, Ryan was at best throwing 105.9 miles per hour," says John-William Greenbaum, who besides knowing a lot about Steve Dalkowski is an expert on testing devices, too.
As Ryan mowed down the Chicago White Sox 3-1 last Saturday for his 18th win of the season, a team of electronics technicians from Rockwell International fidgeted upstairs in the press box with some complicated radar timing equipment. The results supported Ryan's own contention that he throws harder in the late innings, for his fastest pitch of the night was the third one he threw to the Sox' Bee Bee Richard, who led off the ninth inning.

Rockwell timed that high hard one at 100.8 mph, exceeding the 98.6 mph once recorded by Bob Feller with entirely different equipment. Under less official conditions Ryan had thrown even faster. During an 11-inning game on Aug. 20 in which Ryan fanned 19 Detroit Tigers, the technicians timed two of his pitches at 100.9 miles per hour.
- (s4) Feller – From the book "Ebbets to Veeck to Busch: Eight Owners Who Shaped Baseball", by Alan Boxerman, 2003
- (s5) Feller 1946 –
Per NY Times April 15, 1990 article by Dave Anderson, page 2 where he interviewed Feller
My fastball was once timed at 98.6 mph by photo-electric cells at home plate, but by then it was losing speed, maybe as much as 15 mph. That was long before the radar gun they use now... On a radar gun, I would have averaged 105 to 107 mph.
Per New York Times 8/20/1946 articlePrior to the start of the game against the Senators in Washington, using the U.S. Army's Sky Screen Chronograph, Bob Feller's fastball is clocked at 98.6 miles-per-hour breaking Yankees' hurler Atley Donald's 1939 speed record of 94.7 mph.
Per Syracuse Post Standard (New York) Monday, August 14, 1989 article Feller Knows His Smoke Ranks in Fast Company by Steve Jacobson, a columnist for NewsdayFrom the mound, he said, he was timed at 98.6, which some lists include as Feller's mark, but that was terminal velocity, not the average speed of Ryan's mark. �I went right in front of the plate and threw through the triangle.� Feller said �It was was 117.2 mph.� That was muzzle velocity. �Add there and divide by 2 and you get 107.9.� he said �Then I went to 30 feet, 3 inches and was timed at 107-plus. �Then I went out and pitched 13 innings to win, 3-1�.
- (s6) 1912 Speed Test –
Per the 1998 book "Walter Johnson, Baseball's Big Train", by Henry Thomas, pp. 104-105
and the Dec 1912 Baseball Magazine article by F.C. LaneOn October 6 Johnson went from New York to Bridgeport, Connecticut, and the Remington Arms Company's bullet-testing range, for an attempt to gauge the velocity of his pitches. The frequent discussions about Johnson's speed prompted Baseball magazine editor F.C. Lane to put it to a scientific test, after first clearing the idea with Griffith. Also to be clocked was Brooklyn's Nap Rucker, said to be the fastest pitcher in the National League. The rudimentary testing apparatus consisted of a tunnel of fine wires ending at a steel plate. A projectile tripped the wires as it passed through, registering the time, which was then compared to the time of arrival at the steel plate to gauge the speed. After a few warm-up tosses against the steel plate, and still in street clothes, Johnson stepped in, but the tunnel was at shoulder height to measure bullets fired from a standing position and at first Johnson couldn't get his sidearm throws to go straight through to the plate. "At length, however," it was reported, "after some effort and with a consequent loss of speed in an attempt to place the ball accurately, the sphere was successfully hurled in the proper direction, broke one of the fine wires in its transit and collided with a heavy thud against the steel plate." Johnson's best throw was clocked at 122 feet per second (82 m.p.h.), Rucker's at 113, both on their third and last tries.
and per W.J. Macbeth's Sporting Life 11/16/1912 article, Walter Johnson's Speed Excels That of All Pitchers
and per 10/25/1912 The Hardware Reporter article First Test of Speed of Pitched Ball in World's HistoryThe first test was made recently at Bridgeport, Conn., in the factory of a well-known gun firm. Walter Johnson, the crack pitcher of the Washington team, and Nap Rucker, the fork-hand speed boy of the Brooklyn Dodgers, were the pioneers of scientific exploitation. Johnson also established conclusively that he is the speedier hurler for he propelled a ball many feet faster per second than did the illustrious southpaw. At a distance of 25 feet Johnson's pitch travels at a rate of at least 125 feet per second Rucker, who is renowned as a "smoke" slinger, does not approach in velocity by ten feet per second. The test of speed for these illustrious pitchers was made with an appliance used to measure the velocity of the projectiles from firearms. It is a simple enough arrangement, in which electricity figures very prominently. Across a disc-shaped opening are stretched a number of lightly charged electric wires so fine that the breaking of them expands but an infinitesimally small portion of the velocity of a thrown base ball. Five feet behind these wires is a steel plate, also charged. The ball is hurled into the opening. The exact time from the breaking of a wire until the background is hit is registered. By calculating the distance of five feet with the fractional second consumed in traversing it, the happy result is arrived at. Expert gun men declare that the mechanism is so finely arranged that calcula tions may be made into fractional feet per second. Walter Johnson had a great deal more difficulty in hitting the "bull's-eye" than did Rucker. It took four pegs by Johnson to find the mark. Rucker was more fortunate on his first attempt, but after that had more or Jess difficulty. Rucker was satisfied after his trials that Johnson had the more smoke, but he was not satisfied that he had developed the speed of which he is capable..
(see text in the 1912 section)
and per a 1/2/2011 article The First Baseball Speed GunA remarkable article in the December, 1912, issue of Baseball Magazine showed that the first accurate measurements were made decades before the invention of the modern-day radar gun. Titled �One Hundred and Twenty-two Feet a Second!�, the piece sought to measure the speed of the pitches thrown by future Hall of Famer Walter Johnson, widely considered the hardest thrower of his era.
Per October 20, 1912 The Topeka Daily Capital from Topeka, Kansas, Page 6
Per 7/6/1913 San Francisco Call article Swiftest Pitcher's Amazing RecordSPEED OP PITCHED BALLS. Walter Johnson, star pitcher of the Washington Americans, and Nap Rucker, champion southpaw of the Brooklyns, recently established two new records. They succeeded in timing the speed of a pitched ball for the first time in the history of the world, and in order to do this made a record breaking run in an automobile from New York to Bridgeport, Connecticut, and return. The trip was taken one Saturday morning and both pitchers had to be in New York for games that afternoon. They left New York at an early hour in a big Franklin touring car, accompanied by the editor of the Baseball Magazine, one of the feature writers of the New York World and A. P. Lane, champion pistol shot of the world. The distance traveled was 55 miles and in returning to New York the distance had to be made in less than two hours. This was a record run miles was over city pavements. Johnson's best speed record in throwing a baseball, which was made in the test room of the Remington Arms U-M-C company at Bridgeport, was 122 feet per second. The best that Rucker could do was 113 feet per second. The speed for a new government Colt .45 calibre automatic revolver is 800 feet per second, which is about 6 times the speed of Johnson's pitched ball. A high-powered hunting rifle of .35 calibre has a velocity of 2,000 feet per second, or about 16 times Johnson's best record.
see 1912 section for excerpts
- (s7) Dalkowski Speed Test – Per baseball-almanac.com
- (s8) Dalkowski -
Per HardballTimes
and
Pete McEntegart, Sports Illustrated, 6/30/2003 [updated SI link]
and William Blewett's 2013 book (p.58) The Science of the FastballIn an exhibition game that spring [1958] against the Cincinnati Reds in Baltimore's Memorial Stadium, with his parents watching, Dalkowski fanned the side in the ninth on just 12 pitches. He would never again pitch in a big league ballpark. In 1958 the Orioles took Dalkowski to the Aberdeen (Md.) Proving Ground to measure his heater. The experiment did not go well. Dalkowski had pitched the night before and was throwing from a flat surface rather than a mound. Worse, he spent a maddening 40 minutes trying to throw the ball through a laser beam emanating from a metal box about the width of the plate. When he finally got the ball through the laser, the pitch clocked in at 93.5 mph, and everyone went home.
and Ron Shelton's 7/21/2009 Baltimore Sun article Legend of the FallThe only known scientific speed measurement to which his fastball was subjected occurred in June 1958 at Aberdeen Proving Ground, Maryland, where he threw 93.5 mph into a Lumiline on flat ground.
Dalko pitched in a time before radar guns, so nobody is really sure how fast he threw. But the Orioles took him to the Aberdeen Proving Ground and lined him up 60 feet, 6 inches from a tube that judged wind speed. Without a mound, in sneakers, Dalko fired at the tube for nearly an hour, his pitches registering in the mid-90s. Some guess his fastball from a mound approached 110 mph.
- (s9) 1939 speed tests Atley Donald –
Per Thomas Van Hyning in an undated SABR biography piece
Atley Donald
Per a UP article dated 8/31/1939 (found in the 9/1/1939 Lodi News-Sentinal)On August 30 [1939], a primitive machine in Cleveland clocked Atley�s fastball at 94.7 miles per hour, significant because it put him in the �same league� with Bob Feller, albeit a tad faster than Feller at that moment.
Per an article (found in the November 25, 1939 The Record-Argus from Greenville, Pennsylvania, Page 4)CLEVELAND, Aug 31 (UP) - Atley Donald, the New York Yankees' sensational rookie pitcher threw a baseball at the rate of 139 feet per second, or 94.7 miles per hour here last night [8/30/1939] at Cleveland Stadium. Donald's throw was the fastest ever recorded by a speedometer owned by the Cleveland baseball club. The former record was held by Outfielder Dee Miles of the Philadelphia Athletics at 136 feet per second. In 1917 Christy Mathewson was timed at 134 feet per second by a ballistics measurement device in an arms laboratory at Bridgeport, N.Y.
Today we'd like to hark back to the baseball season for a few minutes to review the results of the "speed meter" device which made its appearance up Cleveland way during the summer months. In the four months the motor was in use, approximately 27,000 major and minor leaguers and sandlotters pitched down the machine's two-foot v tunnel, and when the firing was all over the greatest speed recorded� 139 feet per second – was achieved by Atley Donald, of the New York Yankees, and Rudy York [infielder], Ralph [Red] Kress [infielder] and Roy Cullenbine [outfielder] of the Detroit Tigers. That is five feet per second faster than Walter (Big Train) Johnson achieved back in 1917 when his blinding pitching speed was tested at a Bridgeport, Conn. arms laboratory. Steve Sundra Of the New York Yankees and , Wally Moses of the Philadelphia Athletics tied with four sandlot players by heaving the apple 131 foot per second. This was the best sandlot record. "Bob Feller of the 'Cleveland Indiana, believed by many fans to be the fastest of them all, didn't fare particularly well In the meter tests. His best time was 119 feet per second.
- (s10) Feller's motorcycle speed test 1940 -
In Steve Springer's LA Times 7/9/1991 article He's Not Ready to Say Ryan's a Young Feller
In (Fox Sports analyst) Charley Rosen's 4/19/2011 article the first measured fastball"The first time they did it was in 1941 on a street in Chicago in Lincoln Park," Feller said. "Lew Fonseca, the old ballplayer, was the film man for the American League. He set up two cameras and measured the speed of the ball by the speed of the film. "What was crazy is that they had me throwing in competition with a motorcycle. They had the motorcycle start up behind me and come racing by. I was supposed to wind up and throw just as it was passing me. I was a little late and he got about a 10-foot lead, but the film showed the ball getting to the plate ahead of the motorcycle." Feller said his pitch was measured at 104 m.p.h.
In Feller's 4/1/1990 book 'Now Pitching, Bob Feller' pp.111/112:One day early in the 1940 season, Bob Feller�s Cleveland Indians were in Chicago for a series against the White Sox when Lew Fonseca approached him before a game. At the time, Fonseca headed the Major League Film Division, but he once was also an ex-player, good enough to lead the American League in hitting (.369) in 1929. Fonseca�s idea was to have Feller throw his fastball in direct competition with a speeding motorcycle to determine whether the baseball or the cycle would reach home plate first. Not knowing the details of the test (which Fonseca would film), Feller showed up wearing civilian clothes, dress shoes, long pants, a white shirt, and a necktie. The experiment was conducted on a street blocked off by the police near Lincoln Park, where the requisite 60� 6� between the rubber and the plate were carefully measured and marked. In lieu of a catcher, the target was a cantaloupe-sized bull�s-eye suspended from a wooden frame. Feller took off his tie, undid the top button of his shirt and warmed up with Fonseca for a few minutes. When Feller was ready, the driver started his machine and began his run far enough in back of the pitcher so as to pass Rapid Robert motoring at 86-mph just as the ball was released. But the timing was a bit off, and the motorcycle was about two feet beyond Feller when the ball came out of the pitcher�s hand. The test had a pair of incredible outcomes: Feller�s first and only pitch zipped through the middle of the target. And the ball beat the motorcycle to the plate by 13 feet. Using some basic math, the speed of the pitch was determined to be 104-mph.
There was some bad information in the 4/5/1999 ESPN the Magazine article by Peter Gammons Big HeatThere was a lot of talk around baseball that year about how fast my pitches really were. Radar guns were a generation away, but Lew Fonseca came up with a way not only of testing my speed but illustrating it in a dramatic exhibition. Lew was producing instructional films for major league baseball, and his credentials were impressive. He got an idea to test the speed of my fast ball and capture it on film. He wanted it to be man against machine, me against a guy on a motorcycle. I was to throw a standard shooting target, the kind with a bull's-eye. We conducted the test on a hot day on a street along Lake Michigan in Chicago's Lincoln Park. I was in street clothes. Lew wanted me to take my windup with the film rolling and release the ball at the same split second that the man on the Harley Davidson went roaring by. But there was a fraction of a second difference. The motorcycle had a ten-foot jump on my pitch. As the test turned out, it didn't make any difference. The baseball beat the motorcycle to the target anyway. The cycle was going 86 miles an hour when the driver blew past me, but the baseball won by three feet. The pitch was calculated at 104 miles an hour. It was even sweeter than that. Despite my troubles with control, I threw the ball straight through the middle of the bull's-eye. The whole production took one pitch.
In the '40s [it was 1940], Indians righthander Bob Feller�"Rapid Robert"�was brought to a Nevada desert [it was in Chicago] to match his fastball against a speeding motorcycle. (Feller's heater won.)
- (s11) Lew Fonseca – Feller 1940 –
Per 2/26/2007 article The Innovations of Lew Fonseca
Per 1/17/1941 Milwaukee Journal news article name herethese innovations can be said to have originated from the purchase of a $50 16 mm motion picture camera In 1940, pitcher Bob Feller of the Cleveland Indians was widely regarded as perhaps the hardest thrower in the major leagues. It was almost impossible at that time, however, to gauge exactly how fast Feller was capable of hurling the baseball, radar guns having not yet been invented. Fonseca proposed to determine at least a rough idea of Feller's velocity by conducting a test. He arranged to have Feller pitch to a target while a motorcycle paralleled the trajectory of the ball at a constant speed. By filming the ball's flight against the motorcycle, Fonseca was able to draw the scientific conclusion that Feller's fastball traveled at roughly 104 miles per hour. The test provided an answer to a lot of bar bets, as well as tremendous exposure for the game, and Fonseca added the label of "scientist" to his many accomplishments.
- (s12) 1939 test Cleveland – Feller –
Per 6/7/1939 Daily Illini article Boston Red Sox Win Pitching Meter Test
baseball-almanac shows a Richmond (VA) Times Dispatch, June 6, 1939 AP article "Meter to Record Feller's Speed"Boston Red Sox Win Pitching Meter Test CLEVELAND , June 6. (AP) �Three Boston Red Sox threw a baseball 122 feet a second into a new photoelectric pitching meter today. Three Cleveland Indians could do only 119 feet . Pitchers were not included in today's test but unofficially , Bob Feller of Cleveland threw three balls into the meter from a distance of 20 feet. The best mark he recorded was 119 feet. His less-touted teammate, pitcher Johnny Humphreys, recorded 127 feet. There will be a contest for pitchers later. Jimmy Foxx, Jim Tabor, and Roger Cramer made it a clean Boston sweep with the first place tie in today's fielders contest.
baseball-almanac shows a Richmond (VA) Times Dispatch, June 7, 1939 AP article, "Humphreys' 'Hard' Un' Faster Than Feller's, Meter Shows"John A. Crawford of the Cleveland Plain Dealer thought the idea would be useful in selection of pitching and other talents. President Alvin Bradley of the Cleveland Indians agreed and Rex D. McDill, Cleveland electronics engineer, built the machine. The new meter, which gives an immediate reading which engineers said compared with standard laboratory meter accuracy, is built in a trailer. You throw into a hole two feet square. Just inside is a set of photo-electric tubes, and five feet back is another set. The device measures the ball's speed between the two points and flashes it on a scale facing the pitcher.
Per nationwide AP article dated 6/5/1939, and located in the June 6, 1939 Chicago Tribune Sports page, and the Richmond (VA) Times Dispatch, June 6, 1939, and the 6/6/1939 Lewiston Daily Sun.Three Boston Red Sox threw a baseball 122 feet a second into a new photo-electric pitching meter yesterday. Three Cleveland Indians could do only 119 feet. Pitchers were not included in yesterday's test but "unofficially," Bob Feller of Cleveland threw three balls into the meter from a distance of 20 feet. The best mark he recorded was 119 feet. His less-touted teammate, pitcher Johnny Humphreys, recorded 127 feet. There will be a contest for pitchers later. Jimmy Foxx, Jim Tabor, and Roger Cramer made it a clean Boston sweep with a first-place tie in yesterday's fielders contest. The best the Indians could do was a tie at 119 feet by Ben Chapman, Julius Solters and Jim Shilling.
New Machine to Test Speed of Bob Feller

Cleveland, O., June 5.-(AP)

A series of photo-electric cells may settle arguments over who is the speedball king of the major leagues.

A few amateurs warmed up today on a new pitching speed meter. Tomorrow it will test Bob Feller and any other members of the Cleveland and Boston clubs who are willing. Other American league clubs will be given a chance later.

Girl First to Test It.

First Miss Cappy Oguin, a visitor from Orlando, Fla., tried her speed today. Her best was 40 feet a second. A varied assortment of men followed. The best throw was 86 feet a second, the second best, 84. A man of about 60 years old did a foot for each of his years.

Sponsors recalled that in 1917, in Bridgeport (Conn.) arms laboratory, Walter Johnson recorded 134 feet per second, Christy Mathewson, 127, and Smoky Joe Wood, 124. They used a gravity drop interval recorder.

It's Photo Electric.

The new meter, which gives an immediate reading which engineers said compared with standard laboratory meter accuracy, is built in a trailer. You throw into a hole two feet square. Just inside is a set of photo-electric tubes, and five feet back is another set. The device measures the ball's speed between the two points and flashes it on a scale facing the pitcher.
- (s14) 1954 test Bob Turley –
In a May 13, 1954 article by the The Sun, from Baltimore, Md., referred to at
Turley's Pitch Goes 94 M.P.H. on page 23
Per Tom Meany's article Collier's June 25, 1954, pp. 42-43:the article is very short. It didn't mention the sponsor and It didn't describe the measuring device, it just said that it was "one of those complicated electronic devices that measure the speed of a pitch." Also, it didn't report but the integer part of the 94.2 mph speed that can be found in other sources. But it let us know some facts : The test was on Wednesday May 12 of 1954 at Baltimore Stadium with spectators watching. He had served 104 pitches on a game on Sunday. ( I did not know that by then, they already counted the pitches...) That speed was registered "on about his twenty-fifth pitch." The first few pitches didn't registered "because of technical difficulties." Turley had it difficult to "get the ball into the measuring zone, which is considerably smaller than the strike zone." Through the Baseball Reference I found that : The Orioles had that day off. He had won that game on Sunday. Actually, he won a great game: 2-1, 10 innings, 5K, 1BB, 0ER and with only 104 pitches...Amazing! After this, he pitched on Friday and won again, but "only" pitched 8 innings.
and an article by Dan Daniel in The Sporting News. Dec. 16, 1953 page 4 "A's Should Get Better of Deal", the O's and the press already refer to him as "Bullet" well before the bullet speed test in 1954BOB TURLEY, rookie right-hander of the Baltimore Orioles, is the fastest pitcher in baseball today, and he has the oscillograph to prove it. Turley's hard one has been scientifically clocked at 94.2 miles an hour. ...A Du Mont cathode-ray oscillograph test, arranged recently by Collier's, proved that Turley throws a ball from the mound through two light screens six inches apart in .00362 seconds. – Tom Meany Photo captions: – The Oriole pitcher suggested that he might have thrown faster, but he'd only had two days of rest since last start. – Below, photo-electric eye-view of the Baltimore pitcher, all passed through triangular opening, breaking beams from two photoelectric circuits set six inches apart.
Stengel had some tentative talks with Art Ehlers and Jimmie Dykes of the Orioles about Bullet Bob Turley. However, this affair never became serious.
and a 3/31/2013 NYT article by ROBERT D. McFADDEN Bob Turley, Pitcher With a Blazing Fastball, Dies at 82They called him Bullet Bob, and if any proof were needed beyond the 1,265 strikeouts and 101 wins he racked up in 12 seasons in the American League, it was provided early in his career by a DuMont cathode-ray oscilloscope, whose photoelectric eye clocked his fastball at 94 to 98 miles per hour.
Per Popular Science April 1957 article 'How Fast Does a Baseball Travel?', p123The Dumont Company recently used an improved electronic device with which to check figures compiled years ago by the Army. One of the tests made involved the famous pitcher of the New York Yankees, Bob Turley. Using a modified oscillograph, past which Turley threw his fastest pitch, it was found that the figure recorded checked with the pitch at the rate of 94.2 mph, or four miles under the top speed made by Bob Feller when he was in his early twenties.
- (s15) 1960 high speed camera test Turley/Koufax, etc. –
In The Kansas City Star article of June 19, 1960
Who's the Fastest Pitcher By LESLIE LIEBER pp.117-118
From the book High Heat: The Secret History of the Fastball by Tim Wendel p.112Who's the fastest pitcher? By LESLIE LIEBER Charles Horbutt' Rookh Vi. champ: Oriole southpaw Steve Barber pitches to Chicago's Luis Aparicio Baseball fans have been arming for years. Now, here�s the answer! Which major-league pitcher throws the fastest fast ball? Players, sports writers and fans have been arguing this point since Abner Doubleday was in the Little League. But though baseball�s Great Debate has gone on every season without letup, nobody has ever actually tried to get an answer to it. This year we figured it was time that science, busy calculating the speed of rockets to the sun, turned its attention to a problem nearer home plate. Science, in the form of a high-speed camera, co-operated, and for the first time in baseball history we have the real answer to who throws the fastest pitch. The answer is one that will surprise a lot of fans � and we think quite a few players, too. But before we divulge it, we�ll explain how we arrived at it. Several years ago ... Who�s The Fastest Pitcher? Continued from preceding page How the pitchers were tested. ... a group of U.S. Army scientists tried out a new timing device by clocking baseballs thrown by Bob Feller, the Cleveland Indians� great rapid-fire artist, at 98.6 mph. A few years later the DuMont Co. measured Bullet Bob Turley�s fastest pitch on an electronic oscillograph, getting a measure of 94.2 mph. But aside from these two isolated clockings, science has never tackled this burning baseball issue. We didn�t test every pitcher in the big leagues. Instead, we first interviewed managers, coaches and leading hitters in both the American and National Leagues to get a set of nominations. Here are the six names that the experts picked as subjects for our experiment: – Herb Score, Chicago White Sox. Three years ago nearly everyone said this star left-hander was the fastest of them all, but injuries handicapped his career and made him a doubtful quantity. Still, this season our advisory board reported he seemed to be throwing as hard as ever.� – Ryne Duren, New York Yankees. Baseball�s hottest relief pitcher, this bespectacled, bazooka-armed terror had ?? one of the lowest earned-run averages in the majors last year. Most of the experts we consulted were positive Duren was the fastest pitcher throwing today. – Bob Turley, New York Yankees. Bob himself thought his speed ball had lost some of its old-time zip � but several batters disagreed with him. – Sandy Koufax, Los Angeles Dodgers. Last season he tied the major-league record by fanning 18 Giants in a game. The scout who found him said. �A blind man would sign Koufax after hearing the ball hit the catcher�s glove.� – Don Drysdale, Los Angeles Dodgers. This flame-thrower led the league in strikeouts last season with 242 while winning 17 games and leading his team to a world�s championship. – Steve Barber, Baltimore Orioles. Steve was an unknown rookie at the start of this season, but Mickey Mantle and Moose Skowron, who batted against him in spring training, told us to be sure to check him. Baseball�s fastest pitcher Those were the six nominations. Here�s how we did the testing: We set up a high-speed movie camera which takes 50 frames a second. It photographed the ball from the pitcher�s mound until it crossed home plate � 60 feet, six inches away. By counting the number of frames it took the ball to reach the plate, our mathematicians were able to translate the velocity into miles per hour. The results were arrived at not on the basis of one pitch � but by averaging the five fastest pitches thrown by each man. The final standings are: 1. Steve Barber ........95.55 mph 2. Don Drysdale ........95.31 3. Sandy Koufax ........93.20 4 Ryne Duren ..........91.16 5. Herb Score ..........91.08 6. Bob Turley ..........90.75 According to these figures, man�s amazing ability to break speed records each year does not apply to baseball. None of the modern ball blazers equalled Feller�s 98.6 rate of some years back. And how did Feller�s speed rank with the �Big Train,� Walter Johnson, who from 1907 to 1927 won 414 major-league games for a second-division club, striking out 3,497 batters, turning in 56 scoreless innings in succession, pitching three IT alter Johnson shutouts in three days, and winning 36 games in a single year? The best electronic device for timing Walter Johnson we could find was the greatest hitter of all time � Ty Cobb. �Walter Johnson !� We reached Ty Cobb on the phone in Phoenix, Ariz. �No contest!� shouted Cobb.�Walter Johnson is without doubt the fastest pitcher baseball has ever known! I�ve batted against all the old– timers. Johnson is the only pitcher who ever made a baseball hum as it passed the batter!� So now all the votes are in. The fastest pitcher ever, according to the greatest hitter ever, is old Walter Johnson. The fastest pitcher ever recorded by science was not-so-old Bob Feller. And the fastest going in the big leagues today is young Steve Barber. The End
In 1960, Sandy Koufax was one of a half dozen pitchers to be timed by a high-speed camera in a test by This Week magazine.  Koufax was joined by his hard-throwing Dodgers teammate Don Drysdale, as well as Herb Score of the Cleveland Indians, Steve Barber of the Baltimore Orioles, and Bob Turley and Ryne Duren of the New York Yankees.  Unfortunately, the test took place in spring training and was the only time Koufax was clocked.

"You would have thought they would have waited a couple of months until we were in peak condition," Drysdale told Street & Smith's Baseball magazine.  "We were told there was going to be a test of some sort but it was no big deal.  We didn't ever set up for it and it was actually done without us knowing when."

Barber led the pack with an offering of 95.5 miles hour, followed by Drysdale (95.3), Koufax (93.2), Duren (91.1), and Turley (90.7).
- (s16) 1930 West Point Tests Koenig –
Per an article in the May 28, 1937 Spokesman Review, "How fast does a ball travel"
Per article found in 10/6/1936 Pampa (TX) Daily News p.4 [this is bad info]This was scientifically determined back in 1930 when Mark Koenig went to West Point at the request of army engineers and made a test. As a result of the test it was found the ball goes from the pitcher to the batter at the rate of 150 feet per second, or about a mile and a half a minute rate of speed. Going from the pitcher's box to the plate – a distance of 60 feet 6 inches – it will take approximately two-fifths of a second. That doesn't give much time for a batter to duck a wild pitch.
Per the Oakland Tribune Newspaper Archive: May 24, 1930 – Page 9Q. How much time is taken for the ball leaving the pitcher's hand to reach the batter up? A. Mark Koenig went to West Point, New York. May 23, 1930, and, In making a speed test with a baseball before army officers, threw it at a rate of 150 feet per second.
Lou McEvoy High in Pitching Speed Test WEST POINT, N. Y.. May 24 –

With Mark Koenig and Lou McEvoy of the New York Yankees as demonstrators, army ballistics experts discovered yesterday that pitched balls, travel much faster than the 125-feet per second they previously had fixed as the probable average velocity of a thrown ball.

Tests conducted by Capt. H.A. Nisley of the ordnance department here revealed that McEvoy would toss the ball at a rate of 150 feet per second, much to the surprise of military academy officials present.

Koenig stepped before the measuring machine and almost equalled McEvoy's speed.

A new reporter then tried out his arm and propelled the ball at a rate of 110 feet per second.

Catching the spirit, of the thing, Capt. Nisley took a hand, but found that 90 feet per second was his best effort.
- (s17) 1953 Ebbets Field Test Joe Black –
Per an article published in many papers nationwide, located in the Sun Jan 17, 1954 Conn. Sunday Herald,
"Pitching Speed"
Per Scott Merkin MLB.com 2/10/2011 article Black was a giant on and off the fieldPitching Speed In answer to a query frequently posed , the speed at which a pitched baseball travels must be reckoned at approximately 85 to 90 miles an hour on the average. In a test at Ebbets Field last September, conducted by DuMont Laboratories, Inc. on a cathode-ray oscillograph, three Brooklyn [Dodger] pitchers were clocked as follows: Joe Black– 93.20 miles-per-hour, Johnny Podres – 88.50 and Bob Milliken 83.50.
Per Harold Friend's 8/18/2010 Bleacher Report article Baseball History: Hey Charlie Dressen, Leave Joe Black AloneHe became the first African-American pitcher to win a World Series game while pitching for the Brooklyn Dodgers in 1952 and captured the National League Rookie of the Year Award at age 28 with 15 victories, 15 saves and a 2.15 ERA during that same season. Black, who was a friend and roommate with Jackie Robinson while with the Dodgers, also was close with Jesse Owens, who was Martha's godfather. A group including Coleman, Black, Frank Robinson, Lou Brock, umpire Paul Runge, Garagiola and Don Baylor was dubbed "the posse" when they frequently were together, Coleman said.
Per Bill Madden's 5/18/2002 New York Daily News article EX-DODGER JOE BLACK DIES 1ST BLACK PITCHER TO WIN SERIES GAMEIn his rookie season of 1952, Joe Black won 15 games for the Brooklyn Dodgers. He lost only four times, pitched to an ERA of 2.15, an ERA+ of 171, and helped the Dodgers win the pennant. Black was voted the National League's Rookie of the Year, and finished third in the MVP balloting. Black was Brooklyn's top relief pitcher. He appeared in 54 games in relief, but manager Charlie Dressen realized that he was short of starters for the upcoming World Series against New York's other team, the New York Yankees. On Sept. 21, Black made his first start of the season, beating the Boston Braves 8-2. Joe limited the Braves to a pair of runs and three hits in his complete-game victory. Yes, a complete game after more than 50 relief appearances. In the World Series against the Yankees, Black started the first, fourth, and seventh games. Since there were no travel days, he started both the fourth game and the seventh game on two days' rest. Imagine any pitcher, much less a relief pitcher, being allowed to do that today.
Per 9/21/1953 Yonkers Herald Statesman article Black's Pitch 93.2 M.P.H.Unfortunately, Black's success, while meteoric, was also short-lived. After winning NL Rookie of the Year over Giants knuckleballer (and future Hall of Famer) Hoyt Wilhelm, Black never again approached that form. In '53, at the urging of Dressen, he tried to add pitches, only to lose the effectiveness of his fastball. Black won only six games in '53, pitching mostly in relief, and hurt his arm in '54. In '55, the Dodgers traded him to the Reds for outfielder Bob Borkowski, and Black ended his career in '57 with the Washington Senators. He was 30-12 with a 3.91 ERA for his career.
The photo of the day is per Johnny Podres fires his fastball a cathode-ray oscillographBROOKLYN – A new statistic is available for baseball record books throught the use of a precision electronic recording instrument which measures the speed of a pitched ball in miles per hour. The "cathode-ray oscilliograph" developed by Allen B. Du Mont Laboratories, Inc., was tested yesterday before the Dodgers-Phillies doubleheader. It records the speed of a ball pitched through two frames equipped with photo-electric cells. Dodger hurler Joe Black won an informal contest in the demonstration by uncorking a 93.2 mph pitch. Teammates Johnny Podres with 88.5, and Bob Milligan, 83.5, were the only other contestants.
The Baytown Sun 10/5/1953 article SCIENCE makes a visit to Ebbets p.9SEPTEMBER 20: Johnny Podres fires his fastball a cathode-ray oscillograph to determine the speed at which the ball is traveling when it crosses the plate. Johnny's went 88.5, while Joe Black's registered 93.2 Bob Milliken's was caught at 83.5 – but you couldn't prove it by the way the Phils caught up with it. (Photo by Charles Hoff/NY Daily News Archive via Getty Images)
The Marion (OH) Star 9/22/1953 article Joe Black Gains Nod In Test of Fastball Moundsmen p18SCIENCE makes a visit to Ebbets Field, Brooklyn, to test the speed of a pitched ball. Of the Brooklyn pitchers tested, Joe Black, reliefer (sic), whizzed his fast ball at the recording instrument at 93.2 mph. Johnny Podres is on the mound in this test. His speed was 88.5 mph. In the test the Dumont network's cathode-ray oscillograph is used. (International)
The Rome (GA?) News-Tribune 9/22/1953 article Joe Black's Fast Ball Travels 93.2 Miles Per HourJoe Black Gains Nod In Test of Fastball Moundsmen BROOKLYN, N. Y , (NANA)- Sports history of sorts was made at Ebbets Field here prior to the start of a recent doubleheader between the Dodgers and the Philadelphia Phillies. In a test conducted by Du Mont Laboratories engineers, the zooming fast-ball deliveries of Dodger stalwarts Bob Milliken, Billy Loes, Johnny Podres and Ben Wade were measured in addition to those of Joe Black, last year's lifesaver In Brooklyn's 1952 drive for the National League Pennant. In the test, the hurlers pitched their fast ball before the cathode– Ray oscillograph, a product of the Du Mont Laboratories, which measures time to within the minutest fraction of a second. The baseballs were through two frames equipped with photoelectric cells. Purpose of the test was to determine whether any modern-day fast-ball twirler can pitch a baseball at a speed exceeding 100 miles– per hour. This was to be decided by the pitchers throwing a ball through two photoelectric cells so that the speed of their pitches could be accurately reproduced on the face of the cathode-ray oscillograph. This instrument would measure the time that the ball took passing between the two photoelectric screens. The time then was translated Into miles-per-hour and fractions thereof Each pitcher was to have made five deliveries but because they missed passing between the screens on some of their throws varying numbers were made until five tosses by each contender had gone before the oscillograph. Joe Black, with a toss measured at 93 20 miles per hour, was declared the winner and Johnny Podres, 88.50 M. P. H , was r a t e d second. Milliken, at 83 50 M. P. H., placed third. Thus a new statistic is available
Per a recollection of the son of Dr Christaldi, scientist at DumontJoe Black's Fast Ball Travels 93.2 Miles Per Hour NEW YORK-(INS)- Brooklyn's Joe Black throws his fast ball at 93.2 miles per hour. This fact was established when the Dumont Network's cathodeday (sic) oscillograph was used to determine the speed of the pitchers before the Dodgers-Phillies doubleheader. Black was the fastest, with Johnny Podres (88.5) and Bob Milliken (83.5) following their teammate. Philadelphia Manager Steve O'Neill refused to permit Robin Roberts and Curt Simmons to take the test. He said he didn't want to hurt their arms by forcing the to fire hard.
The book Campy: The Two Lives of Roy Campanella by Neil Lanctot p183While at Dumont, Dr. Christaldi contributed to the design of a radar-based �speed gun� that was used by TV station WABD to clock the speed of pitches thrown in at least one broadcast of a Brooklyn Dodgers baseball game. To the best of his son�s recollection, a 90 mph fastball thrown by Joe Black was the fastest pitch registered in that game.
There were no radar guns, only DuMont's crude "cathode ray oscillograph", which clocked Joe Black's fastball at 93.2 miles per hour in a one-shot exhibition at Ebbets in 1953.
- (s18) 1913 Gilbreth, Giants Art Fromme –
Relevant excerpt of a Popular Science magazine April 1917 article (see image posted in 1913 section), titled "Two and a Half Miles a Minute'
Per Spalding's Official Base Ball Guide 1915 by John B. Foster (note that 'Brown' is Brown University) excerpts pp 23-25Mr. FRANK B. GILBRETH, of Providence, R.I. who is known all over the world as an efficiency engineer and who has specialized in motion study... ... he studies with the camera – the motion picture camera – not with the eye. Since it is necessary to know the time occupied in carrying out a given motion, sometimes to the thousandths of a second, and since camera cranks are never turned uniformly, Mr. Gilbreth has invented a special clock which is photographed with the scene. It is a very peculiar clock; for it has only one hand which makes size revolutions per second. That clock appears on every film and the position of its hand enables Mr. Gilbreth to determine the speed of a motion down to the one-millionth of an hour. Behind the catcher, a background is hung, ruled off into one foot squares. Every movement of the pitcher, catcher, batter, ball and bat is photographed against that background. ... With White in the box, Mullaney catching, and Snodgrass at second... The actual time consumed from pitcher to catcher was 0.351 second – a rate of somewhat more than two miles a minute. The caption: ... In one of Mr. Gilbreth's tests, Fromme pitched a ball which, including the wind-up required only .99 seconds until the batter hit it. The time consumed from the moment that it left the hand of the pitcher until it reached the bat was 0.288 seconds. The ball therefore traveled 210.07 feet a second, or 2 2-5 miles a minute. Even speeds of 2.8 miles have been recorded. In that case the batter occupied 0.042 seconds swinging and striking the ball; which means that he began his swing when the ball was 9.24 feet in front of him.
Per a 2011 York University Master's Thesis 'Sports Psychology, Film, and the Analysis of Baseball Data' by Arlie R. BelliveauConsidering that so much attention has been devoted here and there to "Inside Base Ball" the editor of the guide wishes to call attention to a most interesting article which appeared In the New York "Tribune" relative to speed requirements on the Base Ball diamond as perceived by a measuring machine. Experiments were made on the Polo Grounds at various times. As has been stated by the inventor of this machine. It is most interesting, of course, to managers to learn the ability of their players by the use of mechanism which will register to the millionth part of an hour the work of the individuals on the Base Ball field. Managers wish to crumple the foe into a shapeless mass. They try to figure everything out to the fifth of a second. Will the time soon come when a heavy heaver of the ball from right field to third will be asked to pose for the moving picture speed testing machine and obtain a card certifying that he is a whirlwind before a manager will consider his application for a Job? However that may be. the fruits of this exciting experience in the focus of forty thousand eyes are of interest, although for various reasons it was not possible to record all of the motions of the players stationed In front of the camera. By way of beginning the examination of the results. It may be interesting to note what the St. Louis American League players were able to do when the inexorable machine was turned upon them. Eliminating, for the sake of convenience, nil fractions below a fifth of a second, a Brown combination made a play consisting of the pitching of the ball to the batter and its return to second for a put out In 3V4 seconds. This included the short "wind-up" of the pitcher. A second test showed the same time, while a third required 3% seconds for its performance. In the first test of the Giants, with White in the box, Mullaney catching and Snodgrass on second, it required 4.407 seconds for the accomplishment of this cycle of play. More than half of this time, however, was occupied by the pitcher in the "wind-up" before delivering the ball. From the moment the sphere left his hand until it was in the glove of Snodgrass and on the ground behind him. only 1.697 seconds had elapsed. It is difficult for the mind to conceive the speed of the ball in the two throws or the rapidity of the reaction on the part of the catcher. Between the hand of the pitcher and the pocket made by the catcher's pair of hands the interval of time was only .351 of a second. In the course of the brief space the ball traveled at the rate of 185.185 feet a second, or slightly more than two miles a minute. The length of time required by the catcher to recover from the catch and launch the ball on its way past the pitcher to second was almost as long a period as that required for the ball to pass from the pitcher's hands to his, .317 of a second. It required only four-fifths of a second, .790 to be exact, for the winged sphere to pass over the 129 feet between the catcher and the second baseman. This is where the elimination of time counts. Suppose a runner is on first. He wishes to make the steal to second. The pitcher has the ball in his hand. The runner has taken a lead of eight feet and is on tiptoe ready to start for the second bag. He has his eye on the pitcher. The latter raises his arm for a slow "wind-up." It passes behind his head. It begins to move forward. The runner will try, although it will require a lightning dash. With the speed of the wind his feet flash along the path. He is too slow. He is not near the bag when the sound of the ball in the baseman's glove greets his ear. He Is lost. The camera will tell him the reason why. No man living could have done It on foot. The interval of time between that raised hand behind the pitcher's head and the second baseman's glove was only 2.32 seconds. In order to have covered the remaining 82 feet of his Journey from first in that time it would have been necessary for him to travel at the rate of 35.34 feet a second. Had he been able to sprint at this pace and keep it up for a hundred yards he would have established a new record of 8.49 seconds. This is more titan a second faster than the present record of 9 3/5 seconds, made in June. 1906. This is a concrete illustration of why it is so difficult for a runner to steal second if the battery makes no errors. This is an illustration of the fact "that two can play at that game." When a man can throw to second at the rate of 161.6 feet a second, or nearly two miles a minute, a runner must be a hustler to beat the sphere to the keystone bag. In fact, the pitching in this case was apparently by no means phenomenal, so that it might require a fleeter runner than the one pictured to fit the illustration. In one of the tests with the Giants Kromrac pitched a ball which. Including the "wind-up," required only .99 of a second until the batter hit it. The time from the moment it left the pitcher's fingers and until the bat turned Its course upon itself with a snappy crack was .288 of a second. This meant that the ball (raveled at the rate of 210.07 feet a second, or two and two-fifth miles a minute. Still another of the Giants' staff of pitchers tossed the ball to the batter In the space of .275 of a second, or at the rate of 230.30 feet a second. This Is at a rate of 2.8 miles a minute, a speed greater than anything (driven by power located within Itself) has ever attained, so far as known. According to the pictorial record in this case, the swing of the batter's bat until It struck the ball occupied .042 of a second, which would indicate that he began his swing when it was 0.24 feet in front of him. The average speed made by the (Hants' pitchers was .403172, approximately two-fifths of a second, or at the rate of 170.U075 feet a second, while that of the Brown pitchers was approximately .5 of a second, or a tenth of a second slower. The time of some of the Giants pitchers Included In the average shows that they undoubtedly were not throwing at their full speed. If a demonstration were needed, this one would serve to show that certainly one of the differences between a professional pitcher and an amateur is speed. A special timing device probably was hardly required to discover this fact, but this record does show something of what the actual difference is. It goes into the rellnements? of the subject, and if a team manager is looking for speed and a degree of curve, mathematically ascertained, before making a decision regarding a pitcher, it is now possible for him to secure this Information. Mental reaction plays a very important part in Base Ball. The player must make decisions and act upon them quickly. How long does it take a catcher to determine whether to throw to a baseman or not and to act upon the decision? How much time is required by any player In the field, or the batter, or the runner, to decide upon a given action and take it? The determination of this is one of 'the services which such a device as Mr. Gilbreth's may perform for tin* Base Ball manager. In this connection it is interesting to note that in the case of the Brown catcher the Interval between catching the ball and the beginning of the throw to second in one case was .7 of a second and In another .8. The catchers for the Giants in every case recorded started the ball on its flight to second within two-fifths of a second after receiving It, and the average for all was below a third of a second, one throw being made in a trifle over a quarter of a second. This would suggest that the reaction time of a catcher of long experience of the major league class Is one-half that of an average college catcher. This is a point, however, on which It would hardly be fair to generalize beyond saying that reaction Is an important element in play and that upon it hangs the success or failure of a player. There are opportunities for study of the actions of the runner also. This field, perhaps, offers particularly good opportunities for the application of the lessons of motion study. The speed with which the batter gets away from the plate on the journey to first may make all the difference between a hit and an out. With the assistance of the background and its scenarios? it is stated by Mr. Gilbreth that it would be possible to plot the course of the ball on its way to the home plate and to tell at what point in Its flight it began to curve. In the Brown tests it was found that the catcher who was obliged to receive the ball on the left side, if he was a right handed thrower, would have great difficulty in recovering in time to get a ball to second before a runner. The pictures taken at the Polo Grounds showed a number of interesting things. It was noted, in cases where the ball was struck, that the batter lilt it before the pitcher's foot had risen to its full height above the ground. This illustrates the speed with which the ball traveled. In the pictures of the Brown pitcher the ball was photographed leaving his hand before the latter had passed his body, the ball being thrown after the fashion of an apple on the end of a stick. In the pictures of the pitchers of the Giants the ball left the hand, in many cases, after It had passed the center of the swing. One showed It actually on the bat. They also demonstrated the mechanical character of the "wind-up." There was little variation in the duration of this phase of pitching a ball, although each pitcher differed from his fellows in this respect. In other words, each pitcher had n style of his own�a fact which, perhaps, it did not require a moving picture machine to demonstrate. The "windup" in .nearly every case consumed more than 50 per cent of the time occupied in the cycle of pitching a hall and returning it to the second baseman. It is a great stage play, whatever else it may be.
Per Univ Chicago's Motion Pictures in the Human Sciences, online library and discussion forum article The Original Films of Frank GilbrethThe first psychologists known to have intervened with a baseball team were industrial management consultants Frank and Dr. Lillian Gilbreth. In an effort to sell their industrial psychology methods to a wider audience, they filmed the pitching speed and accuracy, hitting, base stealing, and catching of the Brown University baseball team in April of 1913 (Brown, 2005; Lancaster, 2004). The Sunday Providence Journal picked up the story, and it caught the eye of Mr. George H. Daley, sports editor of the New York Tribune newspaper. Daley contacted the Gilbreths to see if they would be interested in conducting similar studies of the New York Giants baseball team. And, on May 31st of 1913 �in the presence of some 20,000 fans, and the �tearing� music of a 70 member Cuban marine band whose battleship was docked offshore� Gilbreth recorded the Giants� pitching and batting speeds and motions, as well as the time needed to steal second base (F.B. Gilbreth Diaries, April 22, 1913 cited in Belliveau, 2011, p. 91). Time and motion measurements were reported in the New York Tribune newspaper, among others that picked up the story (for example: Sporting Life, 1913). It appears, however, that this was the only communication that occurred between the psychologists and the team. Their efforts were not taken seriously, and they were not hired by the Giants to perform further micromotion analyses (New York Tribune, June 1913 cited in Belliveau, 2011). The next instance of sports psychology in American baseball did not occur until 1938 when Mr. Phillip K. Wrigley, owner of both the gum company and the Chicago Cubs baseball team, hired Dr. Coleman Griffith. Griffith had opened the first sports psychology laboratory at the University of Illinois in the 1920s. He had been developing his methods with football and other college teams for several years before losing his funding during the depression (Green, 2003, 2009). Accepting the contract, Griffith took what was considered then to be high definition films of the players. He wrote extensive reports on their reaction times, and suggested altering practice efforts to mimic the real stress of a game. Unfortunately, due to skeptical players, and an uncooperative team manager, few of his suggestions were implemented, and he eventually lost the contract in 1940 (Green, 2009). Is it possible that the Cubs and Giants were wrong to dismiss these psychologists so soon?
The �industrial efficiency� expert Frank Gilbreth (1868-1924) conducted his motion studies, both in the United States and abroad, in factories, offices, hospitals and other workplaces between about 1910 and 1924. Gilbreth made his films with a 35 mm hand crank camera. The films below, despite their claim to be �original,� were actually compiled by James Perkins and Lillian Gilbreth after Gilbreth�s death in 1924. The original films are presumed lost.
- (s19) 1933 West Point Gomez/Mungo –
Book: 2008 'The Neyer/James Guide to Pitchers: An Historical Compendium of Pitching', By Bill James, Rob Neyer, p.318
Book: Walter Johnson, Baseball's Big Train by Henry W. ThomasVan Mungo Baseball's Famous Pitchers (Ira L. Smith, 1954) Comment: "Probably he is faster than any pitcher in the major leagues today. On an off-day last season, he went up to West Point with a party of pitchers, among them Lefty Gomez, to have his speed measured by the apparatus used at the military academy to test the speed of bullets. Gomez made a creditable showing – but Mungo, when he cut loose, almost broke the machine."
In June 1933, Van Lingle Mungo of the Dodgers and Lefty Gomez of the Yankees, two of the fastest pitchers of the era, were tested at West Point's department of ballistics and mathematics, presumably with more sophisticated equipment. Mungo registered 113 feet per second and Gomez 111 on their best throws.
- (s20) various Maloney Gossage –
The Book: 'The Baseball Companion', 1991 by Angus Garber III, Angus Garber
and 'Inside Baseball' by Greg Garber 1996
The Book: "The Great All-Time Baseball Record Book", by Joseph Reichler, 1981FASTEST PITCHERS Bob Feller, Cleveland Indians, 107.9 mph, 1946 Nolan Ryan, California Angels, 100.8 mph, 1974 J.R. Richard, Astros, 100.0 mph, 1978 Walter Johnson, Washington Senators, 99.7 mph, 1914 Jim Maloney, Cincinnati Reds, 99.5 mph, 1965 Rich "Goose" Gossage, New York Yankees, 99.4, 1984 Lee Smith, Chicago Cubs, 99.0 mph, 1984 Steve ...
The Book: Who's Who in Baseball History, Lloyd Johnson 1994, p269Nolan Ryan, 1974 – 100.8 MPH J.R. Richard, 1978 – 100.0 MPH Walter Johnson, 1914 – 99.7 MPH Jim Maloney, 1965 – 99.5 MPH Rich Gossage, 1980 – 99.4 MPH [note the other book says 1984] Bob Feller, 1946 – 98.6 MPH Others of note: Don Drysdale, 1960 – 95.3 Joe Wood, 1912 – 94.5 Sany Koufax, 1960 – 93.2 Christy Mathewson, 1914 – 91.3
Youtube, Rare Color WGNTV-Jim Maloney 10 Inning No-hitter August 19, 1965Clocked at 99.5 mph that year [1965], Maloney and his fastball were credited with two no-hitters. The first lasted 10 innings against the last place Mets before two hits in the 11th beat him 1-0. Maloney fanned 18 in that game.
Per Union Tribune San Diego 9/5/2005 article No Hit Connection
Per an interview with Mr. Maloney Looking Back: Jim Maloney Was A Nashville Vol by Bill Traughber / Nashville Baseball Historian 04/30/2012, Maloney doesn't mention his speed testJIM MALONEY April 30, 1969 | Aug. 19, 1965 Known for a blazing fastball clocked at 99.5 mph in 1965, the longtime Reds right-hander tossed two no-hitters in the majors. The first was a 10-inning effort against the Cubs at Wrigley Field. Earlier in 1965, he also threw 10 hitless innings against the Mets, but lost the no-hitter and the game on an 11th-inning homer. Maloney also threw five one-hitters and compiled a 134-84 record with a 3.19 ERA in 12 seasons. He played for the PCL Padres in 1962.
Per interview with Billy Joe Bowman, in Still Blazing : At Age 42, Ryan Hasn't Slowed Up All That Much on May 21, 1989 by MARK HEISLER"I threw a fastball, curve and a change-up," said Maloney. "My change-up was mediocre. I sure would like to have learned how to throw that full circle change that they throw today. I didn't know anything about it. Turner had me change off the curve ball. I threw a real hard curveball that was maybe three-quarters speed that acted like a change-up. That helped me. I used that in the big leagues. They did not have a speed gun in those days, but I'd say I was pitching close to 100 miles per hour on my fastball."
"I got him [Nolan Ryan] at Chicago one ballgame at 99 m.p.h.," says Billy Joe Bowman, who operates the Astros' radar gun.

"The reason I remember it so vividly, Lee Smith was throwing that day. Lee Smith also threw one 99. The ball was way out of the strike zone, but it was still 99.

"Nolan's velocity would vary sometimes from ballgame to ballgame, but he'd always reach a stretch where he'd get to his maximum velocity, and then he'd just come right on. And here he comes!
- (s21) Forster 94.9 mph 9/74 –
Per Baseball Library entry
Terry Forster
Book: Who's Who in Baseball History, 1994, by Lloyd Johnson and Brenda Ward, p.143 , and Book: The Ballplayers 1990 by Mike Shatzkin, Stephen Holtje, James Charlton p.350His fastball was clocked at 94.9 mph that September 7, but by the next season he was on the shelf with a bad arm;
Per April 4, 1975 Yuma (AZ) Daily Sun(who's who only) A pitching phenom at 18, Forster was pitching in the majors by age 19. (both) From 1971 to 1973 he hurled an incredible 138 1/3 innings without surrendering a home run. Forster was the AL Fireman of the Year in 1974, with a league-high 24 saves. That September his fastball was clocked at 94.9 mph.
Terry Forster anchors the Chicago bullpen. Just 23, he'll be entering his fifth major league season. His fastball has been timed at 94.9 miles per hour, ranking him fifth among all major league pitchers clocked, including Bob Feller and Nolan Ryan.
- (s22) 1974 Ryan Forster –
Per Long Beach (CA) Independent Press-Telegram 9/8/1974, pp.S-1 and S-2
Page S-1 (65)
Ryan beats the clock, 100.8 mph-and Chicago
By DON MERRY Staff Writer
They could have cited Nolan Ryan for speeding Saturday night. Ryan beat the clock and the Chicago White Sox, in that order, hitting a high of 100.8 miles per hour in a 3-1 decision over the Sox to officially become what everybody has long suspected – the hardest thrower in baseball history. Recorded history, at least. Ryan's fastest pitch of the evening came as he faced Bee Bee Richard in the ninth inning and it surpassed by more than two seconds Bob Feller's old standard of 98.8. Almost sheepishly, Ryan said he considered it "an off-night. "I'm sure I've thrown faster than that," he said. While other people were concerned' with estimating – ANGEL OF DAY NOLAN RYAN won 18th game with 3-1 win over Chicago on six-hitter – Ryan's speed, the Angel pitcher privately thought to himself that he was capable of bettering 100 mph. "I felt if all the conditions were right I could better 100," he said. "But for a while I thought the contest was going to backfire." Ryan threw five warm– up pitches prior to the game and his clocking by Rockwell International were anything but startling. His fastest effort was 88.5 while his slowest was 55.0. "I bet you were worried right about then," Ryan said to promotion director George Lederer "I was a little concerned myself." Ryan actually bettered Feller's record in the fourth inning when he was caught at 98.9 [note: scoreboard shows 98.8] while in the

Page S-2 (68)
(Continued from Page S-l) process of pitching to Jerry Hairston. And back on Aug. 20 when the Rockwell team was experimenting for Saturday night's official timing, Ryan was clocked at 100.9. Ryan was hardly overpowering. He struck out nine a mundane figure for him and had control problems, too, issuing seven walks. But he got the big play when he needed it. Centerfielder Morris Nettles raced to the deepest part of the park and leaped above the fence to rob Pat Kelly of a grand slam home run to close out the sixth inning. Thus, Ryan was able to secure his 18th victory, putting him two triumphs away from his objective of 20 wins. Ryan said he tried to put the contest with its attendant carnival-type atmosphere out of his mind but that he did not completely succeed. "Everybody has been asking me about it and it has been in the papers just about every day for the past he sighed. "I tried not to think about it too much but it was something I couldn't completely ignore." The Angels scored single runs in the third, fourth and seventh innings to help Ryan out-duel rookie Jack Kusek, a hard thrower in his own right whose fastest clocking was a respectable 90.4. Singles by Denny Doyle and Orlando Ramirez sandwiched around Tom Egan's sacrifice put the Angels on the board in the third and they scored again in the fourth on a walk to Bruce Bochte, Joe Lahoud's bloop single and Dave Chalk's scoring ground ball. Singles by Bucky Dent, Richard and Tony Muser deprived Ryan of a shut-out in the fifth and the Angels gave him an insurance run in the seventh when Frank Robinson was hit by a pitch, took third on Chalk's single and scored on a wild pitch by White Sox relief pitcher Terry Forster. For the rest of the night it was Ryan vs. the clock. Ryan won that contest, too.

Caption
Page S-2
Ryan's Express?
Scientists announced Saturday night that Angel pitcher Nolan Ryan had thrown a baseball faster than anyone – 100.9 miles per hour.  But he didn't do it Saturday night, but rather on Aug. 20.  Scientists timed Ryan at 100.8 Saturday night after he warmed up with tosses of 68.5, 55, 88.5 and 70.7 mph.
- (s23) 1974 Ryan Forster –
Per an AP report on 9/8/1974, located in The Bakersfield Californian p.23
, and also in the 9/9/1974 Sarasota Herald-Tribune p.5
ANAHEIM (AP) – Nolan Ryan almost matched his unpublicized record of 100 9 miles per hour for a pitched baseball Saturday night and said he doesn't care for the scientific scrutiny of his pitches. "I don't like to do it because it takes too much away from my concentration," the California Angel strikeout king said after beating the Chicago White Sox, 3-1. His fastest pitch recorded by infrared radar was 100.8 m.p.h., a ninth inning fast ball to Bee Bee Richard, who wound up walking. It was disclosed before the game that Ryan actually broke Bob Feller's 28-year– old record of 98.6 m.p.h. last Aug. 20 when he struck out 19 Detroit Tigers in an 11 inning defeat.

He threw 100.9 twice in that game, the first coming against the Tigers first batter of the game, Ron LeFlore. The Angels said they did not reveal Ryan's speed from the Aug. 20 test because they planned to stage a contest which has more than 6,000 entrants guessing the speed of Ryan's pitch Saturday night. A crowd of 13,510 paid to see Nolan win his 18th game against 15 defeats. He gave up six hits, striking out nine and throwing 159 pitches.

Ryan said he learned that he had broken the record "just before the game. I wasn't surprised. I felt as fast that night as I've ever been. " Ryan wasn't sure that his fastest effort was recorded Saturday night because the measuring device set up by an industrial firm 's only guaged balls in the strike zone. "A lot of balls I threw out of the strike zone may have been my best pitches, velocity wise," Ryan said. Ryan said that he had to struggle with his rhythm for seven innings and was asked if the test caused him to throw too bard. "I wasn't going to let it affect me," he said. "It's not going to interfere with my primary goal of 20 wins. But any time you do something like this you've got to be prepared for the worst and I'm glad to get it over." Ryan said he hasn't "been at my best" since that Aug. 20 appearance and "It looked for a while as though the contest might backfire on us." Going into the ninth inning, Ryan's fastest pitch was 98.8 m.p.h. to Jerry Hairston in the fourth inning.

(in some reports) Feller set the record in a test conducted by the U.S. Army involving five pre-game warmup pitches.
- (s24) 1946 Feller dispute –
Per 8/21/1946 Abilene (TX) Reporter-News p.8
, and the The Amarillo Globe-Times from Amarillo, Texas p.12
Per 8/26/1946 The Morning Herald from Hagerstown, Maryland p.68Bob Feller's High, Hard One Travels 98.6 Miles an Hour WASHINGTON, Aug. 21--(PP) It was easy to see today why so many American league batters miss Bobby Feller's high, hard one– it travels 98.6 miles per hour! In a pre-game throwing test last night, before he was beaten by the Senators,5 to 4, the Cleveland Indians' speedball king hurled a baseball at a speed of 145 feet per second to better the former record of 139 feet per second--or 04 miles per hour--set by Alley Donald. (The Army?) measure device measured the speed of the pitch, from the mound to the plate, to within 1-10,000th of a second.
Per The Saturday Evening Post, Volume 219, 1947, p. 170New York, Aug. 25 (/P) Bob Feller's fast ball has been timed at 145 feet per second, although batters who have faced the Cleveland ace undoubtedly are convinced there was something wrong with the timing device, or that a sun dial was used in the test. They're sure his slow ball travels faster than that. Anyway, the accurate timing of the pitch gives an idea of what it takes to be a first-class major league hitter, and how lucky a batter is to get as much as a foul off one of Feller's sizzlers. Based on the 145-foot per second speed, it takes the bail approximately four-tenths of a second to reach the plate.
[Feller] agreed to have his fastball measured for speed by a chronograph at Griffith Stadium – for $600 or $120 for each of the five baseballs he fired. He satisfied the 31,000 customers, Griffith and himself by establishing a record of 145 feet per second, or 98.6 miles per hour.
- (s25) Bio Ryan –
Per 8/22/1989 Chicago Tribune article
Von Ryan Express motors right along sports page 4/ p64
Ryan, 43 next January, is still capable of throwing a 97-mile-an-hour fastball (average speed:93.2 m.p.h.) in his 23d major league season.

According to radar guns and other measuring devices, Ryan said his fastball on an average, was clocked at 93.7 m.p.h. when he was with Houston in 1980; last year [1988], his last season with Astros, it was timed at an average of 93.2.
- (s26) 1974 Ryan Test –
Per 9/6/1974 Long Beach Press-Telegram article by Loel Schrader p.29
The Pasadena, CA Star News September 1, 1974, p.35 had more info in their photo captionPhoto caption Nolan Ryan gets a look at one of the Rockwell International devices that will be used to time his fastball Saturday night. Looking on are Jimmy Yamamoto, Walt Davis and Larry Telk of Rockwell. Ryan Fast, but how about Dalkowski? They are going to time Ryan's fastball Saturday night [9/7/1974] at Anaheim Stadium. Pity the poor catcher. Ryan has struck out 19 batters in a game three times this season and has gone over the 300 strikeout mark for the third consecutive season, which puts him i a class by himself. The event is of such attractive proportions as to lure a CBS television crew to the Big A [Anaheim]. The network plans to show the Ryan films during the course of the U.S. Open Tennis Championships Sunday between noon and 3 p.m., PDT.
The August 30, 1974 Progress Bulletin from Pomona, California, p.19 had more details of the contestPhoto caption WATCH YOURSELF– Nolan Ryan has look at radar screen, one of three Rockwell International devices to be used for hit fastball clocking at Anaheim Stadium on Saturday, Sept. 7. Looking on are Rockwell (from left) Jimmy Yamamoto, Walt Davis and Larry Telk. Ryan will attempt to break Bob Feller's 98.6 mph record, set in 1946. Fans may send speed guesses (to nearest mph) and the number of pitches Ryan will throw in the game to Ryan Express, Box 3820, Anaheim 92803. Grand prize is an all-expense-paid trip for two to the first two games of the American League Championship Series, Oct. 5-6.
Per the September 2, 1974 Independent Press-Telegram from Long Beach, California, p.14The Angels are staging a contest in conjunction with the experiment. Fans will have the opportunity to guess Ryan's top speed by sending entries on a postcard to Ryan Express, P.O. Box 3820. Anaheim, CA 92803. Estimates should be made to the nearest one-tenth mile per hour. Entries also should include the number of pitches Ryan will make during the game of Sept. 6 [later changed to Sep 7]. This figure to be used only in case of ties for speed. Postcards must be received by September 5. Grand prize will be a trip tor two to the first two games of the American League Championship series in the Western Division City, October 5-6. Other prizes are an Angels desk watch, an Angels pen and pencil set with official emblems, and 25 baseballs autographed by Ryan. Winners need not be present on Sept. 6.
Ryan's fastball has 'em guessing George Lederer is not the type to engage in excesses or superlatives. But the public relations director of the Angels is excited about an event scheduled Saturday night at Anaheim Stadium. On that evening, when the Angels face the Chicago White Sox, Nolan Ryan's fastball will be timed for speed by a team of scientists from Rockwell International. Many of the hard-throwing pitchers from the past have been timed on the speed of their pitches, and the record is held by Bob Feller, whose fastball was timed at 98.6 miles per hour in 1946. There are many who believe Ryan will exceed Feller's record, including, perhaps, the CBS Television Network, which will have a film crew on hand to record the event for airing on its Sunday, Sept. 8, show, "The CBS Sports Spectacular." The Angels are holding a guessing contest in conjunction with Ryan's attempt at the pitching speed record. Fans may send their postcard guesses on Ryan's top speed to Ryan Express, P.O. Box 3820, Anaheim, CA 92803. Estimates should be made to the nearest tenth of a mile per hour, and entries also should include the number of pitches Ryan will make during the game against the White Sox. Entries must be received by Thursday. "We've had more then 3,000 entries and they have come from all over the country," says Lederer, who covered such flamethrowers as Sandy Koufax and Don Drysdale when he covered the Dodgers as a writer for this newspaper. "We've had entries from just about every city in California, including a large number from Long Beach," adds Lederer. "Long Beach ranks third in the number of entries behind Los Angeles and Anaheim. We've also received entries from people in towns and cities around the country that I've never heard of. "People in the New York area who followed Ryan when he was with the New York Mets seem greatly interested. We have entries from Brooklyn, White Plains, Far Rockaway, Stoneridge and Yonkers. The response has been amazing." Naturally, prizes which will be given to contest" winners has triggered the interest. But the fact that Ryan is the most exciting pitcher in baseball has added enhanced the attraction.
- (s27) 1974 Bio Ryan Rockwell test– Per 1993 VHS video, 'Nolan Ryan: Feel The Heat'
- (s28) 1954 Dumont Turley test– Per picture in a German HiFi forum
- (s29) 1917 test Johnson Wood Mathewson–
Per baseball-almanac.com where they reference an AP article posted in the Richmond (VA) Times Dispatch, June 6, 1939 (article also appears in the June 6, 1939 Chicago Tribune Sports page1, and the 6/6/1939 Lewiston Daily Sun)
Per an article (found in the November 25, 1939 The Record-Argus from Greenville, Pennsylvania, Page 4)Sponsors recalled that back in 1917, in Bridgeport (Conn.) arms laboratory, Walter Johnson recorded 134 feet per second, Christy Mathewson 127 and "Smoky Joe" Wood 124. They used a gravity drop interval recorder.
Per Tom Verducci's 4/4/2011 Sports Illustrated article Radar LoveThat is five feet per second faster than Walter (Big Train) Johnson achieved back in 1917 when his blinding pitching speed was tested at a Bridgeport, Conn. arms laboratory.
In Cleveland in 1917 a wire-and-steel contraption called a "gravity drop interval recorder" timed Johnson, Christy Mathewson and Smokey Joe Wood, some of the era's hardest throwers. They produced respective readings of 134, 127 and 124 feet per second. (A 95-mph fastball travels 139 feet per second.)
- (s30) Walter Johnson vs a Motorcycle Myth? –
Per 8/14/1989 article that appeared in the LA Times
The Speed Kings of Baseball
and the 8/14/1989 Syracuse Post Standard
Feller Knows His Smoke Ranks in Fast Company
by STEVE JACOBSON with Newsday
Johnson and Smokey Joe Wood were measured against a speeding motorcycle; when do you start the clock and when do you stop it is the great variable.

Walter Johnson's 97 mph of 1914 was guesstimated against the motorcycle.
Page Update History
- (u12)11/9/2014 made the 102+ list 'Method' more accurate for pre Pitch F/X pitches.
- Ryan now 'laser radar' was 'doppler laser radar'. 'Doppler' is redundant.
- Feller now 'chronograph' was 'artillery'. These devices are simply chronographs plus two screens, which can be used for many things.
- Turley now 'chronograph' was 'oscillograph'.
- Dalkowski now 'chronograph' was 'artillery'.
- Black now 'chronograph' was 'oscillograph'.
- Lidge now 'radar' was 'TV radar'. TV makes no difference.
- 11/9/2014 spelling – corrected more spelling errors than there are bears in the woods. I left a few for hardy spell-checkers.
- 10/22/2014 after MLB Network said 'no pitcher has thrown 100 mph in the World Series since 2007', ensured that World Series fastest pitch was listed – added 2006 and 2012 info that was missing.
- 10/9/2014 Bio-Feller – noted the dispute over 145 fps and 99.6/96.86 mph
- 10/9/1974 Bio-Ryan/1974 – added more details to the 1974 test – found 3 more pitchers with readings Lolich, Kucek, and Forster. Corrected announcement of 1st test results which were actually a secret until the 2 test was over.
- 10/7/2014 1954/102+ – added Bob Turley's 1954 speed test pitch of 103.2 mph FFE to 102+ mph list
- (u11)10/7/2014 – complete revamp of the 1912-1974 Era – very complete history of various speed tests
- 10/5/2014 1953/102+ – added Joe Black's 1953 speed test pitch of 102.2 mph FFE to 102+ mph list
- 10/3/2014 102+ – added 'Rank' column to the 102+ list
- 10/3/2014 102+ – added internal links from 102+ list to that year's data
- (u10) Pitch F/X – 10/3/2014 added any available information from Pitch F/X data retained for spring training games from 2008 through 2014. This data review moved Andrew Cashman up to 6th the 102+ list from 102.0 mph (2012) to 103.3 mph (2012).
- (u9) 10/2/2014 Pitch F/X – corrected Pitch F/X years 2007, 2010-2013 to add post season 100+ pitches (for some reason, Fangraphs does not include post season data for Pitch F/X)
- 10/1/2014 Navigation – since the page is rather lengthy, I added internal page navigation links so you can jump to and from sections easily, or link to them directly
- 9/28/2014 Pitch F/X – for 2008-2014 seasons added qty pitches thrown per season over 101/102/103/104/105 mph
- 9/24/2014 Radar/102+ – added a 2nd 102 mph pitch for Robb Nen on 10/18/1997 during Game 1 of the 1997 World Series, plus a picture of the stadium radar
- (u8) 9/19/2014 Pitch F/X – added the 2006 post season Pitch F/X data, and the 'Good Articles Related to Fastest Speeds' section
- 9/18/2014 Pitch F/X – Joel Zumaya – found an additional 102.7 mph pitch on 6/23/2009 which matches his season high on 6/30/2009
- 9/18/2014 Radar/102+ – added Jeremy Accardo to the 102+ list (2006 season)
- 9/18/2014 Radar – rearranged the 2002-2007 seasons in the Radar section
- 9/14/2014 Pitch F/X – added every date for each 100+ speed for year 2007 Pitch F/X list
- 9/12/2014 Radar/102+ – added Mark Lowe to the 102+ list after discovering reports per note (r11) avbove where he threw 102 mph on 8/2/2006.
- 9/11/2014 corrected the 2011 List – added Rubby De La Rosa (100.3 mph) and Brandon League (100.1 mph).
- (u7) 2/20/2014 Radar – added a note to the 2007 list about not including Roy Halladay's 101.8 mph pitch that shows up in his FanGraphs.com Pitch F/X page. After reviewing the Pitch F/X data on 6/30/2007, the pitch showed a 'start speed' of 101.8 and an 'end speed' of 80.1. This is not possible.
- 11/28/2013 FFE – added section comparing plate speed of Ryan, Feller, and Chapman.
- (u6) 11/19/2013 Bio-Feller – added section on Bob Feller's 1938 motorcycle speed test in Chicago
- 11/10/2013 Bio-Ryan – added 6 GIFs of Nolan Ryan
- (u5) 11/8/2013 Pitch F/X – added 2013 fastest pitchers
- 3/8/2013 Radar – added Sidd Finch section. 5/11/2013 consolidated the Sidd Finch info into one section.
- (u4) 12/13/2012 Bios – added animated GIFs for Feller, Chapman, Rodriguez, Zumaya
- 12/13/2012 Radar – Moved Lidge, Wagner, Gagne, Pena, Turnbow, Kerry Wood, and Randy Johnson to 'Former Players' section of radar readings.
- 12/13/2012 NYT articles link at source (q) was corrected
- 12/13/2012 Expired link at source (r18) The Sporting News, 9/25/1995 was replaced with active link at The Baltimore Sun, 9/17/1995 page 2
- (u3) 12/11/2012 Pitch F/X – added 2007, 2010, 2011, and 2012 fastest pitchers from manual review of Fangraph PITCH F/X data,
appended by the MLB PITCH F/X detail data.
Added 'source' info under Pitch F/X section.
Dalkowski now 10th fastest (was 6th). Wohlers now 7th fastest (was 4th).
Added Nolan Ryan plate speed calculation.
Added FFE section to explain the FFE calculations.
11/8/2013 corrected Nate Jones max velocity from 100.1 to correct 101.1 mph. Added Tommy Hunter to the 2012 list at 100.1 mph. Added Edwin Jackson to 2007 at 100.0 mph and to 2010 at 100.1 mph. Added Mitchell Boggs to 2010 at 100.4 mph. Added Jonathan Papelbon to 2007 at 100.0 mph.
9/11/2014 Pitch F/X – corrected 2011 list – added Rubby De La Rosa (100.3 mph) and Brandon League (100.1 mph). - (u2) 12/11/2012 verified my 2008 and 2009 Pitch F/X info against FanGraphs version and discovered my error in 2008 Joel Zumaya max speed was actually 101.3 not 101.0 (my version rounded Zumaya from 101.3 to 101.0). Added source note to 2008 and 2009 data.
- 12/5/2012 Define – corrected Pitch F/X definition – uses only 2 cameras, not 3. They are apparently 60 fps, not 30 fps. Added Dr. Nathan's Pitch F/X Guide link.
- 3/10/2010 Define – approx. added more radar gun explanations and images
- late 2009 Pitch F/X – added 2009 Pitch F/X records
- late 2008, but before 2/11/2009 Pitch F/X – added 2008 Pitch F/X records
- 12/14/2008 approx. PreRadar – added most of 'Pre Radar' section
- 8/11/2008 original page, blog post on 8/12/2008